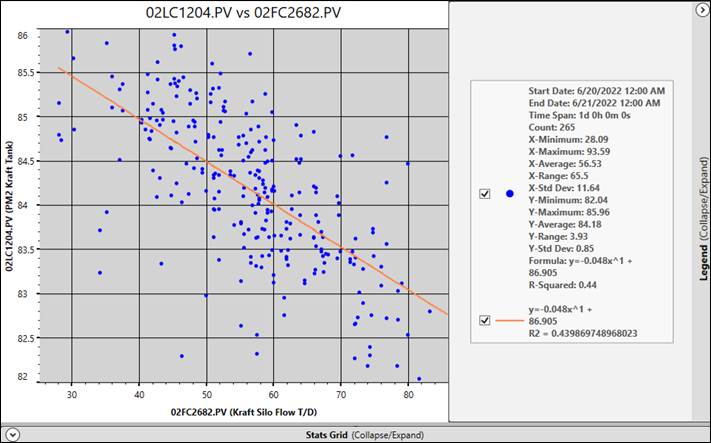
The legend is a collapsible section of the plot area that shows information about the dates, times, X and Y averages, ranges, and standard deviations of the X/Y chart data. When a Curve Fit is selected, the formula and R-Squared value will be shown as well. Use the checkboxes and to hide and show the plots and curve fits.
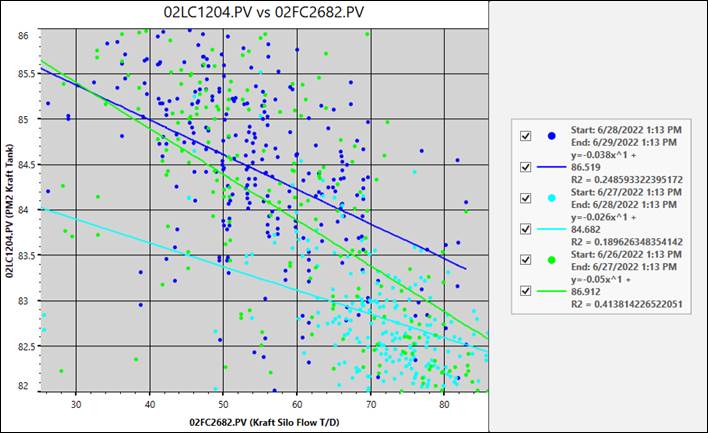
When the X/Y chart contains multiple runs, the legend shows the color-coding and start and end times of the runs. All of the other information that is displayed for one run can be found in the Stats Grid when it is checked.