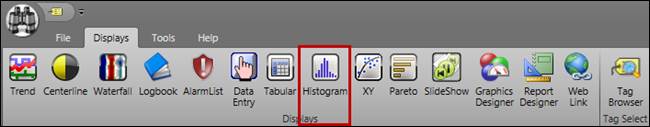
To create new histograms, click the Histogram button on the PARCview Explorer’s Displays tab, or right-click in the file area of PARCview, hover over Add Display, and then select Histogram.
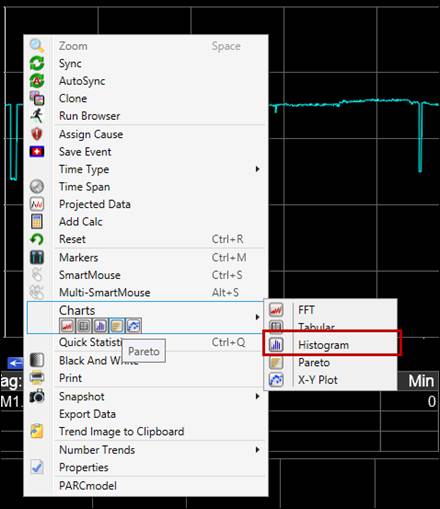
To create a histogram from a trend, right-click the plot area, hover over Charts, and then select Histogram. The chart that is created will use the source Trend’s tags and time span, and it will automatically load data. The tag used to create the histogram is the first tag in the grid, but the trend’s other tags are available in the tag selector.
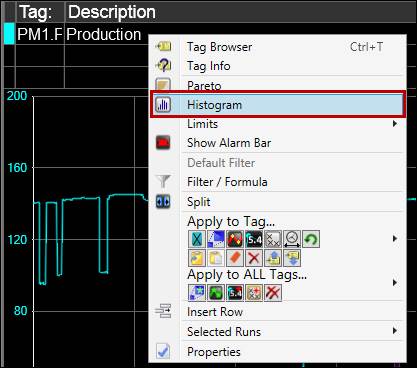
To create a histogram for a just specific tag, right-click that tag’s row in the tag grid, then select Histogram.