Tabular charts can be created from scratch or launched directly from a Trend.
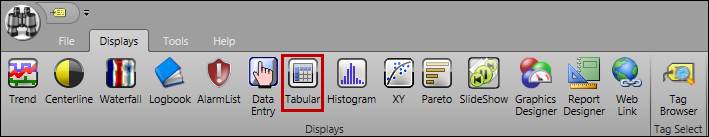
To create new tabular charts, click the Tabular button on PARCview Explorer Display Ribbon, or right-click in the file area of PARCview, hover over Add Display, and then select Tabular.
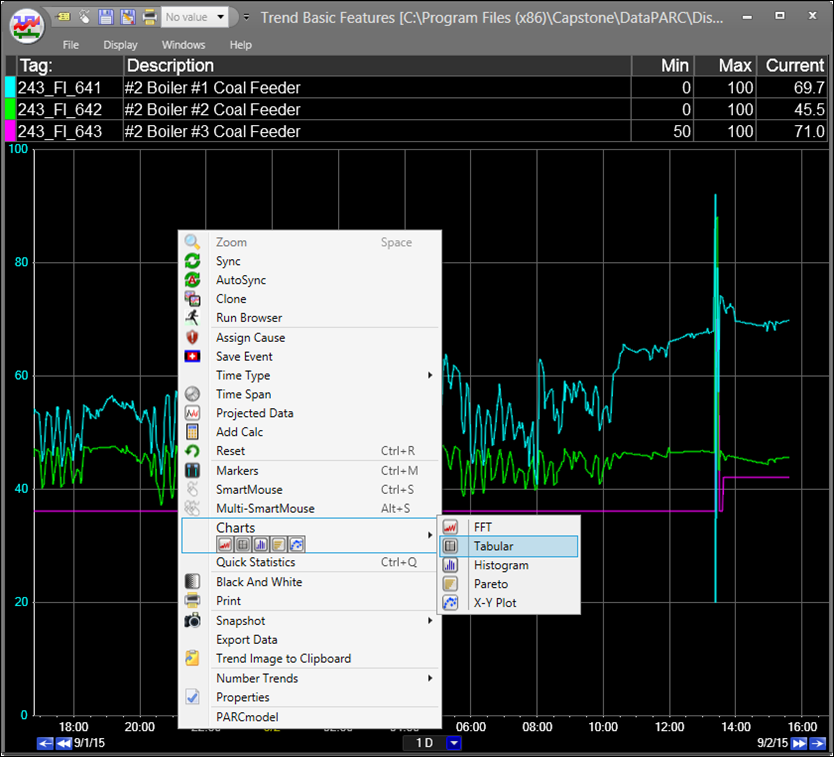
To create a tabular chart from a trend, right-click the plot area, hover over Charts, and then select Tabular. The chart that is created will use the source Trend’s tags and time span, and it will automatically load data.