This content is currently unavailable in Ja - 日本語. You are viewing the default (English) version.
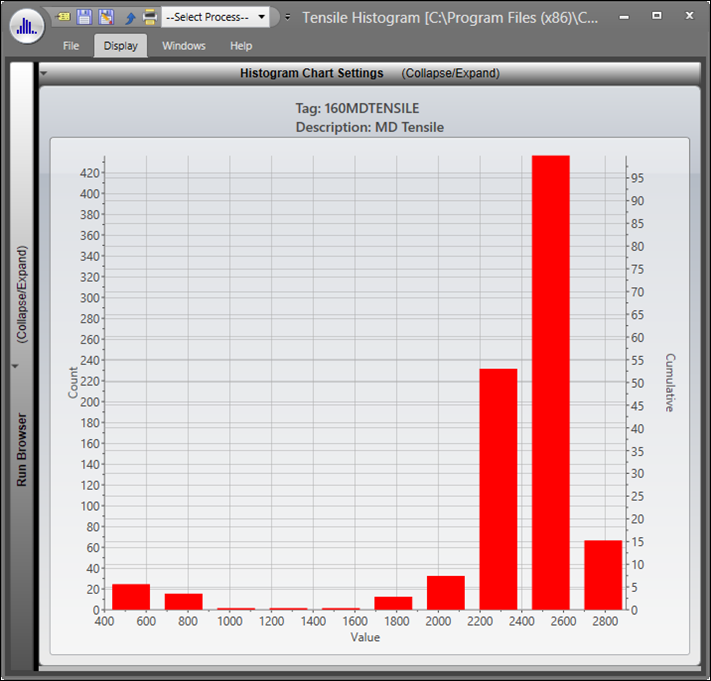
A Histogram is a chart that plots the frequency of values in a tag. The Y-Axis consists of the frequency (either count or percentage) and the X-Axis consists of the tag value ranges being plotted.