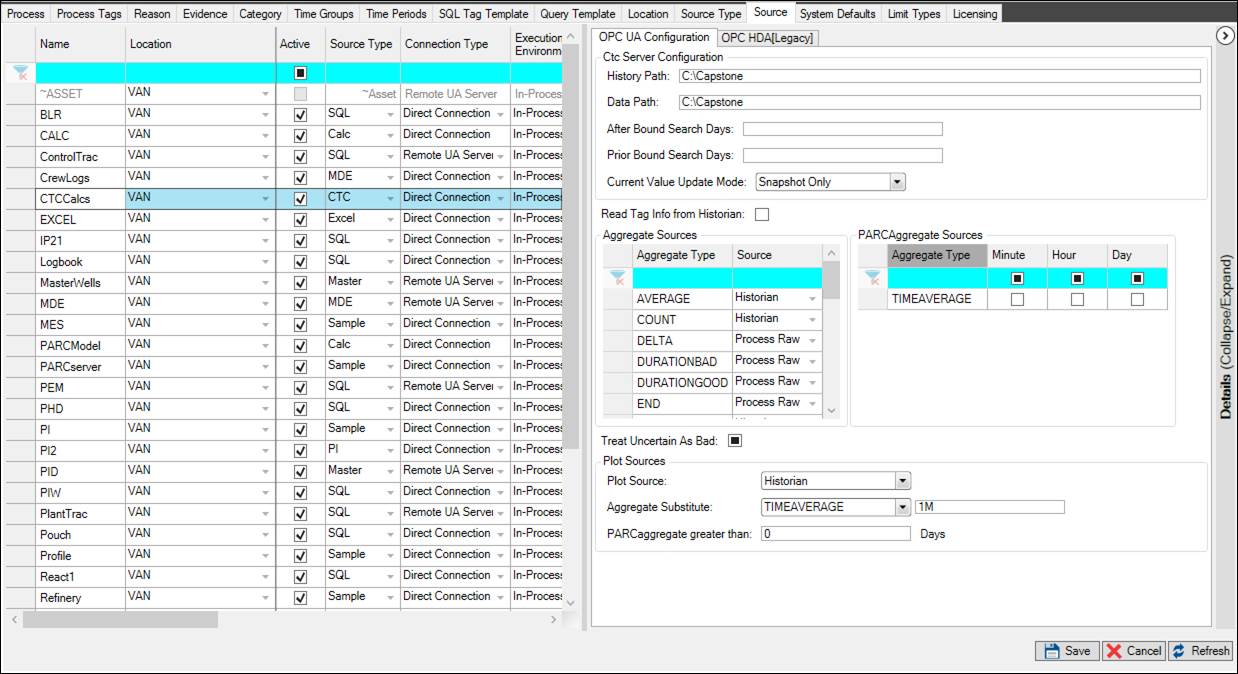
The Source tab is used to configure the various data sources or interfaces that PARCview will communicate with. The Source grid lists all configured sources and their basic properties. The Configuration tabs show advanced and source-specific properties for the selected source.
Save: Save changes to sources. Same as saving from the ribbon.
Cancel: Discard changes.
Refresh: Reload grid from database.
Source Grid
The source grid lists all configured sources and their basic properties. Enter or modify values in the grid to configure the basic properties.
To configure a new source, create a new row and begin with Name, Location and Source Type, then complete the remaining required configurations to activate the source.
Name: The name of the source. It is better to keep this name short but descriptive. It is used as part of the tag definition. Must be unique within a site. No spaces allowed.
Location: The Location of the source.
Active: Allows the source to be used in PARCview. Inactive sources will not appear in the Tag Browser.
Source Type: The type of the source. Pick from a drop-down list. Configuration varies by source. The source type generally represents the connection type or underlying historian type.
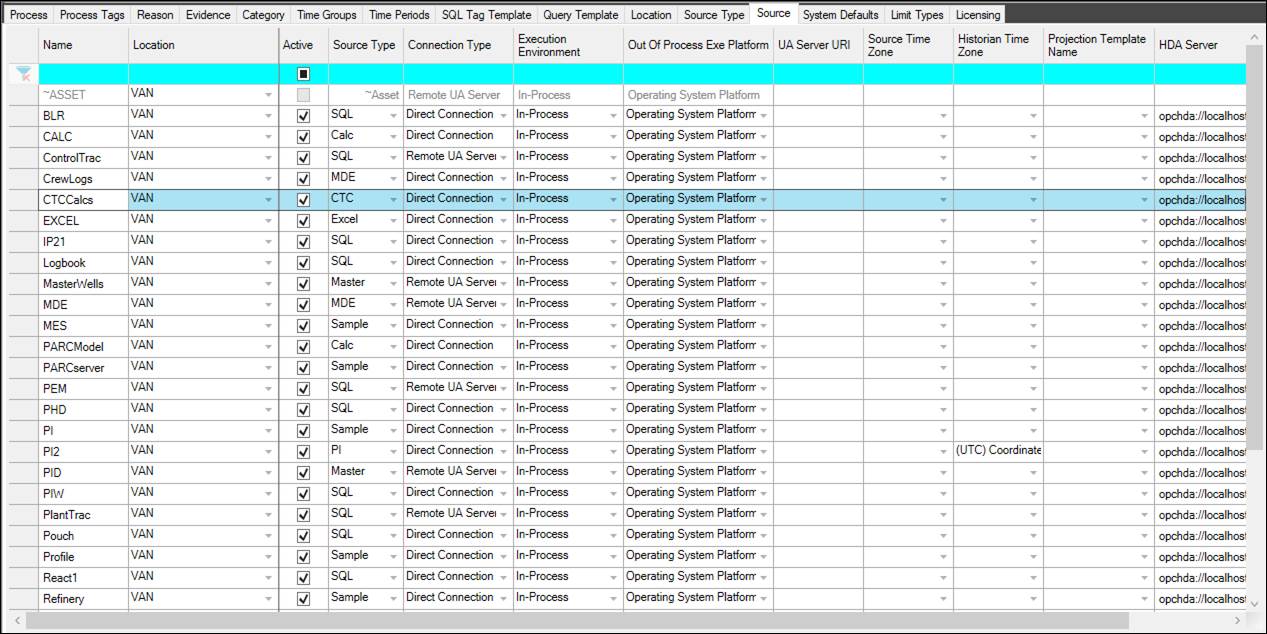
Connection Type: Defines how clients will connect to a data source.
Remote UA Server: Connect to source using a remote instance of UA Server specified in UA Server URI field. If field is blank, uses site’s primary UA Server.
Direct Connection: Connect to source directly using local PARCview client. Clients must be able to connect individually to the data source.
HDA Server: Connect to source using OPC HDA Server. Specify server address in HDA Server Field.
Execution Environment: Environment in which to execute data connection: inside or outside host process.
In-Process: Execute inside the host process. Host is determined by connection type: UA Server or PARCview client.
Out of Process: Launch a separate executable outside of host process.
Out of Process on Mismatch: If a source is configured with a direct connection type, attempt to execute in-process unless source connection platform does not match PARCview’s architecture. The most typical case would be attempting to connect to data source using 32-bit dll’s or drivers from a 64-bit PARCview client.
Out Of Process Exe Platform: If either out of process execution environment is used, which platform type to use.
Operating System Platform: Use local OS system type platform.
32 Bit: Force using a 32 bit out of process executable.
64 Bit: Force using a 64 bit out of process executable.
UA Server URI: Address of Remote UA Server. If blank, uses site’s primary UA Server.
Source Time Zone: The time zone where data will be viewed. This also affects fixed aggregate intervals, as in the Day aggregate will be midnight-to-midnight in this time zone.
Historian Time Zone: For sources where data is read directly (e.g. PARChistory/SQL), this is the time zone used to store data. For sources where data is read through a historian SDK (e.g. PI/PHD/IP21/Proficy), this is the time zone the SDK uses.
Projection Template Name: The name of the Projection Template SQL query. This query can be designed in the SQL Tag Template tab of System Configuration.
HDA Server: The address of the HDA server used by the client, either local or remote. This is for sources using the HDA Server connection type.
Local HDA Server: Use the client’s HDA server. Enter: opchda://localhost/ctc.opchda.1
Central Remoting HDA Server: Use the central remoting HDA Server. Enter: gtcphda://SERVER/ctc.opchda.1 (replace SERVER with server name or IP address).
Source Configuration
The Source Configuration panel shows advanced and source-specific properties for the source selected in the grid. The options in the panel vary based on the selected source type.
CALC Source Type

Tag Info
Read Tag Info from Historian: Read tag info from underlying historian instead of Process Tags list.
Aggregate Sources
For an aggregate type, select the source of the calculate statistic: Historian or Process Raw. These aggregates are calculated when requested by the client via tag switch. See Aggregates for more information.
Historian: Return statistic from historian. This assumes the historian stores or can calculate the statistic. If not, it will fall back to process raw.
Process Raw: PARCview client calculates the statistic from raw data.
PARCaggregate Sources
Check off the aggregate types that PARCaggregate will calculate for this source. These aggregates are time-weighted averages calculated over the minutes of the hour, hours of the day, and days of the year. See Aggregates for more information.
Minute: Aligned minute of the hour, e.g. 01:00 to 01:01, 01:01 to 01:02, etc. not including the end time of each interval.
Hour: Aligned hour of the day, e.g. 01:00 to 02:00, 02:00 to 03:00, etc. not including the end time of each interval.
Day: Aligned day of the year, e.g. 01/01/2001 00:00 to 01/02/2001 00:00, 01/02/2001 00:00 to 01/03/2001 00:00, etc. not including the end time of each interval.
Data Quality
Treat Uncertain As Bad: If aggregate produces value of uncertain quality, treat as bad quality for this source.
Plot Sources
Plot Source: Specify source of plot-reduced data set used in Trends.
Historian: Return plot-reduced data set from historian. This assumes the historian stores or can calculate the plot-reduced data set. If not, it will fall back to process raw. Can be set to use PARCaggregate when the timespan exceeds the threshold set in the "PARCaggregate greater than" setting below.
Process Raw: PARCview client calculates the plot-reduced data set from raw data
UseAggregateSubstitute: Use the selected Aggregate Substitute instead of a plot-reduced data set.
Aggregate Substitute: This setting only applies when Plot Source is set to UseAggregateSubstitute. Select a statistic and enter the interval over which it will calculate. Specify the interval as a number followed by a time key letter (S for seconds, M for minutes, H for hours, D for days).
PARCaggregate greater than: This setting only applies when Plot Source is set to Historian. When the timespan of a trend is greater than this number of days, use PARCaggregate plot reduction. Missing periods are filled in based on selected Plot Source.
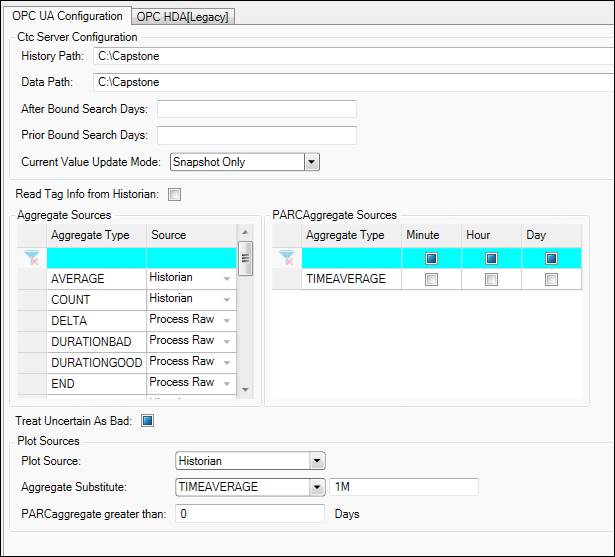
CTC Source Type

CTC Server Configuration
History Path: File path where PARChistory data files are located. Typically: \\SERVER\Capstone\Realtime\Data
Data Path: File path where data files written out by PortIO are located. Typically: \\SERVER\Capstone\PortIO\Data
After Bound Search Days: How many days after the end time to search for a bounding point.
Prior Bound Search Days: How many days before the start time to search for a bounding point.
Current Value Update Mode:
Snapshot Only: The source will read current values from the snap file and historical values from the historian upon opening. New current values will be read from the snap file only.
Snapshot and History: The source will read current values from the snap file and historical values from the historian upon opening. When the display updates, new current values will be read from the snap file and all historical values will be reread from the historian. This is used to fill in possible gaps of data that are in the historian, but not in the snap file. Note that this may affect performance in trends
History Only: All values will be read from the historian.
Tag Info
Read Tag Info from Historian: Read tag info from underlying historian instead of Process Tags list.
Aggregate Sources
For an aggregate type, select the source of the calculate statistic: Historian or Process Raw. These aggregates are calculated when requested by the client via tag switch. See Aggregates for more information.
Historian: Return statistic from historian. This assumes the historian stores or can calculate the statistic. If not, it will fall back to process raw.
Process Raw: PARCview client calculates the statistic from raw data.
PARCaggregate Sources
Check off the aggregate types that PARCaggregate will calculate for this source. These aggregates are time-weighted averages calculated over the minutes of the hour, hours of the day, and days of the year. See Aggregates for more information.
Minute: Aligned minute of the hour, e.g. 01:00 to 01:01, 01:01 to 01:02, etc. not including the end time of each interval.
Hour: Aligned hour of the day, e.g. 01:00 to 02:00, 02:00 to 03:00, etc. not including the end time of each interval.
Day: Aligned day of the year, e.g. 01/01/2001 00:00 to 01/02/2001 00:00, 01/02/2001 00:00 to 01/03/2001 00:00, etc. not including the end time of each interval.
Data Quality
Treat Uncertain As Bad: If aggregate produces value of uncertain quality, treat as bad quality for this source.
Plot Sources
Plot Source: Specify source of plot-reduced data set used in Trends.
Historian: Return plot-reduced data set from historian. This assumes the historian stores or can calculate the plot-reduced data set. If not, it will fall back to process raw. Can be set to use PARCaggregate when the timespan exceeds the threshold set in the "PARCaggregate greater than" setting below.
Process Raw: PARCview client calculates the plot-reduced data set from raw data
UseAggregateSubstitute: Use the selected Aggregate Substitute instead of a plot-reduced data set.
Aggregate Substitute: This setting only applies when Plot Source is set to UseAggregateSubstitute. Select a statistic and enter the interval over which it will calculate. Specify the interval as a number followed by a time key letter (S for seconds, M for minutes, H for hours, D for days).
PARCaggregate greater than: This setting only applies when Plot Source is set to Historian. When the timespan of a trend is greater than this number of days, use PARCaggregate plot reduction. Missing periods are filled in based on selected Plot Source.
Excel Source Type
Tag Info
Read Tag Info from Historian: Read tag info from underlying historian instead of Process Tags list.
Aggregate Sources
For an aggregate type, select the source of the calculate statistic: Historian or Process Raw. These aggregates are calculated when requested by the client via tag switch. See Aggregates for more information.
Historian: Return statistic from historian. This assumes the historian stores or can calculate the statistic. If not, it will fall back to process raw.
Process Raw: PARCview client calculates the statistic from raw data.
PARCaggregate Sources
Check off the aggregate types that PARCaggregate will calculate for this source. These aggregates are time-weighted averages calculated over the minutes of the hour, hours of the day, and days of the year. See Aggregates for more information.
Minute: Aligned minute of the hour, e.g. 01:00 to 01:01, 01:01 to 01:02, etc. not including the end time of each interval.
Hour: Aligned hour of the day, e.g. 01:00 to 02:00, 02:00 to 03:00, etc. not including the end time of each interval.
Day: Aligned day of the year, e.g. 01/01/2001 00:00 to 01/02/2001 00:00, 01/02/2001 00:00 to 01/03/2001 00:00, etc. not including the end time of each interval.
Data Quality
Treat Uncertain As Bad: If aggregate produces value of uncertain quality, treat as bad quality for this source.
Plot Sources
Plot Source: Specify source of plot-reduced data set used in Trends.
Historian: Return plot-reduced data set from historian. This assumes the historian stores or can calculate the plot-reduced data set. If not, it will fall back to process raw. Can be set to use PARCaggregate when the timespan exceeds the threshold set in the "PARCaggregate greater than" setting below.
Process Raw: PARCview client calculates the plot-reduced data set from raw data
UseAggregateSubstitute: Use the selected Aggregate Substitute instead of a plot-reduced data set.
Aggregate Substitute: This setting only applies when Plot Source is set to UseAggregateSubstitute. Select a statistic and enter the interval over which it will calculate. Specify the interval as a number followed by a time key letter (S for seconds, M for minutes, H for hours, D for days).
PARCaggregate greater than: This setting only applies when Plot Source is set to Historian. When the timespan of a trend is greater than this number of days, use PARCaggregate plot reduction. Missing periods are filled in based on selected Plot Source.
IP 21 Source Type
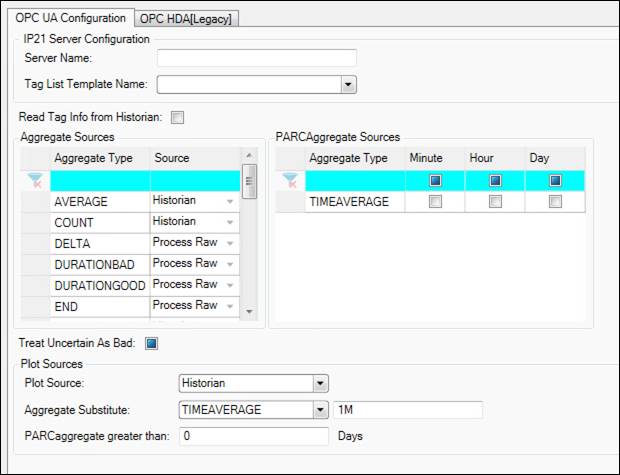
IP21 Server Configuration
Server Name: Enter name of IP21 Server.
Tag List Template Name: Select SQL Tag Template used to retrieve tag list for this source.
Tag Info
Read Tag Info from Historian: Read tag info from underlying historian instead of Process Tags list.
Aggregate Sources
For an aggregate type, select the source of the calculate statistic: Historian or Process Raw. These aggregates are calculated when requested by the client via tag switch. See Aggregates for more information.
Historian: Return statistic from historian. This assumes the historian stores or can calculate the statistic. If not, it will fall back to process raw.
Process Raw: PARCview client calculates the statistic from raw data.
PARCaggregate Sources
Check off the aggregate types that PARCaggregate will calculate for this source. These aggregates are time-weighted averages calculated over the minutes of the hour, hours of the day, and days of the year. See Aggregates for more information.
Minute: Aligned minute of the hour, e.g. 01:00 to 01:01, 01:01 to 01:02, etc. not including the end time of each interval.
Hour: Aligned hour of the day, e.g. 01:00 to 02:00, 02:00 to 03:00, etc. not including the end time of each interval.
Day: Aligned day of the year, e.g. 01/01/2001 00:00 to 01/02/2001 00:00, 01/02/2001 00:00 to 01/03/2001 00:00, etc. not including the end time of each interval.
Data Quality
Treat Uncertain As Bad: If aggregate produces value of uncertain quality, treat as bad quality for this source.
Plot Sources
Plot Source: Specify source of plot-reduced data set used in Trends.
Historian: Return plot-reduced data set from historian. This assumes the historian stores or can calculate the plot-reduced data set. If not, it will fall back to process raw. Can be set to use PARCaggregate when the timespan exceeds the threshold set in the "PARCaggregate greater than" setting below.
Process Raw: PARCview client calculates the plot-reduced data set from raw data
UseAggregateSubstitute: Use the selected Aggregate Substitute instead of a plot-reduced data set.
Aggregate Substitute: This setting only applies when Plot Source is set to UseAggregateSubstitute. Select a statistic and enter the interval over which it will calculate. Specify the interval as a number followed by a time key letter (S for seconds, M for minutes, H for hours, D for days).
PARCaggregate greater than: This setting only applies when Plot Source is set to Historian. When the timespan of a trend is greater than this number of days, use PARCaggregate plot reduction. Missing periods are filled in based on selected Plot Source.
IP SQL Source Type

Tag Info
Read Tag Info from Historian: Read tag info from underlying historian instead of Process Tags list.
Aggregate Sources
For an aggregate type, select the source of the calculate statistic: Historian or Process Raw. These aggregates are calculated when requested by the client via tag switch. See Aggregates for more information.
Historian: Return statistic from historian. This assumes the historian stores or can calculate the statistic. If not, it will fall back to process raw.
Process Raw: PARCview client calculates the statistic from raw data.
PARCaggregate Sources
Check off the aggregate types that PARCaggregate will calculate for this source. These aggregates are time-weighted averages calculated over the minutes of the hour, hours of the day, and days of the year. See Aggregates for more information.
Minute: Aligned minute of the hour, e.g. 01:00 to 01:01, 01:01 to 01:02, etc. not including the end time of each interval.
Hour: Aligned hour of the day, e.g. 01:00 to 02:00, 02:00 to 03:00, etc. not including the end time of each interval.
Day: Aligned day of the year, e.g. 01/01/2001 00:00 to 01/02/2001 00:00, 01/02/2001 00:00 to 01/03/2001 00:00, etc. not including the end time of each interval.
Data Quality
Treat Uncertain As Bad: If aggregate produces value of uncertain quality, treat as bad quality for this source.
Plot Sources
Plot Source: Specify source of plot-reduced data set used in Trends.
Historian: Return plot-reduced data set from historian. This assumes the historian stores or can calculate the plot-reduced data set. If not, it will fall back to process raw. Can be set to use PARCaggregate when the timespan exceeds the threshold set in the "PARCaggregate greater than" setting below.
Process Raw: PARCview client calculates the plot-reduced data set from raw data
UseAggregateSubstitute: Use the selected Aggregate Substitute instead of a plot-reduced data set.
Aggregate Substitute: This setting only applies when Plot Source is set to UseAggregateSubstitute. Select a statistic and enter the interval over which it will calculate. Specify the interval as a number followed by a time key letter (S for seconds, M for minutes, H for hours, D for days).
PARCaggregate greater than: This setting only applies when Plot Source is set to Historian. When the timespan of a trend is greater than this number of days, use PARCaggregate plot reduction. Missing periods are filled in based on selected Plot Source.
MACS Source Type
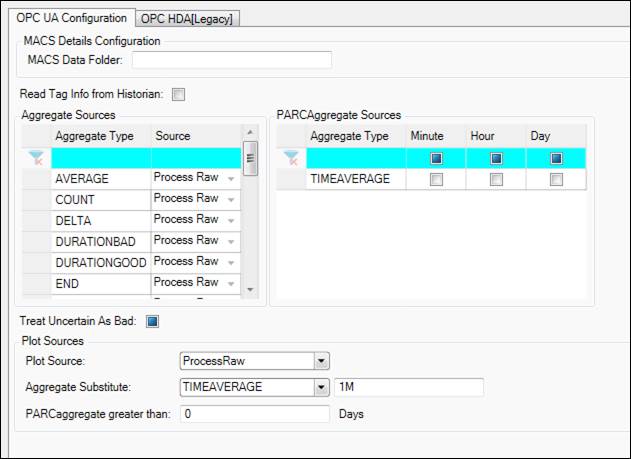
MACS Details Configuration
MACS Data Folder: Location of MACS data folder.
Tag Info
Read Tag Info from Historian: Read tag info from underlying historian instead of Process Tags list.
Aggregate Sources
For an aggregate type, select the source of the calculate statistic: Historian or Process Raw. These aggregates are calculated when requested by the client via tag switch. See Aggregates for more information.
Historian: Return statistic from historian. This assumes the historian stores or can calculate the statistic. If not, it will fall back to process raw.
Process Raw: PARCview client calculates the statistic from raw data.
PARCaggregate Sources
Check off the aggregate types that PARCaggregate will calculate for this source. These aggregates are time-weighted averages calculated over the minutes of the hour, hours of the day, and days of the year. See Aggregates for more information.
Minute: Aligned minute of the hour, e.g. 01:00 to 01:01, 01:01 to 01:02, etc. not including the end time of each interval.
Hour: Aligned hour of the day, e.g. 01:00 to 02:00, 02:00 to 03:00, etc. not including the end time of each interval.
Day: Aligned day of the year, e.g. 01/01/2001 00:00 to 01/02/2001 00:00, 01/02/2001 00:00 to 01/03/2001 00:00, etc. not including the end time of each interval.
Data Quality
Treat Uncertain As Bad: If aggregate produces value of uncertain quality, treat as bad quality for this source.
Plot Sources
Plot Source: Specify source of plot-reduced data set used in Trends.
Historian: Return plot-reduced data set from historian. This assumes the historian stores or can calculate the plot-reduced data set. If not, it will fall back to process raw. Can be set to use PARCaggregate when the timespan exceeds the threshold set in the "PARCaggregate greater than" setting below.
Process Raw: PARCview client calculates the plot-reduced data set from raw data
UseAggregateSubstitute: Use the selected Aggregate Substitute instead of a plot-reduced data set.
Aggregate Substitute: This setting only applies when Plot Source is set to UseAggregateSubstitute. Select a statistic and enter the interval over which it will calculate. Specify the interval as a number followed by a time key letter (S for seconds, M for minutes, H for hours, D for days).
PARCaggregate greater than: This setting only applies when Plot Source is set to Historian. When the timespan of a trend is greater than this number of days, use PARCaggregate plot reduction. Missing periods are filled in based on selected Plot Source.
Master Source Type
Tag Info
Read Tag Info from Historian: Read tag info from underlying historian instead of Process Tags list.
Aggregate Sources
For an aggregate type, select the source of the calculate statistic: Historian or Process Raw. These aggregates are calculated when requested by the client via tag switch. See Aggregates for more information.
Historian: Return statistic from historian. This assumes the historian stores or can calculate the statistic. If not, it will fall back to process raw.
Process Raw: PARCview client calculates the statistic from raw data.
PARCaggregate Sources
Check off the aggregate types that PARCaggregate will calculate for this source. These aggregates are time-weighted averages calculated over the minutes of the hour, hours of the day, and days of the year. See Aggregates for more information.
Minute: Aligned minute of the hour, e.g. 01:00 to 01:01, 01:01 to 01:02, etc. not including the end time of each interval.
Hour: Aligned hour of the day, e.g. 01:00 to 02:00, 02:00 to 03:00, etc. not including the end time of each interval.
Day: Aligned day of the year, e.g. 01/01/2001 00:00 to 01/02/2001 00:00, 01/02/2001 00:00 to 01/03/2001 00:00, etc. not including the end time of each interval.
Data Quality
Treat Uncertain As Bad: If aggregate produces value of uncertain quality, treat as bad quality for this source.
Plot Sources
Plot Source: Specify source of plot-reduced data set used in Trends.
Historian: Return plot-reduced data set from historian. This assumes the historian stores or can calculate the plot-reduced data set. If not, it will fall back to process raw. Can be set to use PARCaggregate when the timespan exceeds the threshold set in the "PARCaggregate greater than" setting below.
Process Raw: PARCview client calculates the plot-reduced data set from raw data
UseAggregateSubstitute: Use the selected Aggregate Substitute instead of a plot-reduced data set.
Aggregate Substitute: This setting only applies when Plot Source is set to UseAggregateSubstitute. Select a statistic and enter the interval over which it will calculate. Specify the interval as a number followed by a time key letter (S for seconds, M for minutes, H for hours, D for days).
PARCaggregate greater than: This setting only applies when Plot Source is set to Historian. When the timespan of a trend is greater than this number of days, use PARCaggregate plot reduction. Missing periods are filled in based on selected Plot Source.
MDE Source Type
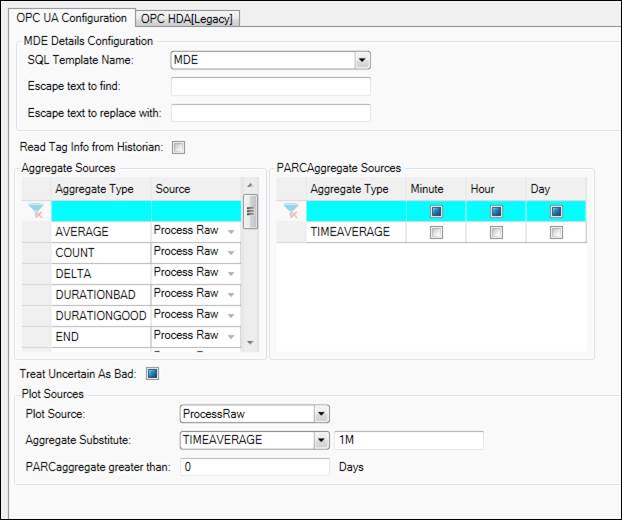
MDE Details Configuration
SQL Template Name: Select MDE.
Escape text to find: Enter text to escape.
Escape text to replace with: Enter replacement for escaped text.
Tag Info
Read Tag Info from Historian: Read tag info from underlying historian instead of Process Tags list.
Aggregate Sources
For an aggregate type, select the source of the calculate statistic: Historian or Process Raw. These aggregates are calculated when requested by the client via tag switch. See Aggregates for more information.
Historian: Return statistic from historian. This assumes the historian stores or can calculate the statistic. If not, it will fall back to process raw.
Process Raw: PARCview client calculates the statistic from raw data.
PARCaggregate Sources
Check off the aggregate types that PARCaggregate will calculate for this source. These aggregates are time-weighted averages calculated over the minutes of the hour, hours of the day, and days of the year. See Aggregates for more information.
Minute: Aligned minute of the hour, e.g. 01:00 to 01:01, 01:01 to 01:02, etc. not including the end time of each interval.
Hour: Aligned hour of the day, e.g. 01:00 to 02:00, 02:00 to 03:00, etc. not including the end time of each interval.
Day: Aligned day of the year, e.g. 01/01/2001 00:00 to 01/02/2001 00:00, 01/02/2001 00:00 to 01/03/2001 00:00, etc. not including the end time of each interval.
Data Quality
Treat Uncertain As Bad: If aggregate produces value of uncertain quality, treat as bad quality for this source.
Plot Sources
Plot Source: Specify source of plot-reduced data set used in Trends.
Historian: Return plot-reduced data set from historian. This assumes the historian stores or can calculate the plot-reduced data set. If not, it will fall back to process raw. Can be set to use PARCaggregate when the timespan exceeds the threshold set in the "PARCaggregate greater than" setting below.
Process Raw: PARCview client calculates the plot-reduced data set from raw data
UseAggregateSubstitute: Use the selected Aggregate Substitute instead of a plot-reduced data set.
Aggregate Substitute: This setting only applies when Plot Source is set to UseAggregateSubstitute. Select a statistic and enter the interval over which it will calculate. Specify the interval as a number followed by a time key letter (S for seconds, M for minutes, H for hours, D for days).
PARCaggregate greater than: This setting only applies when Plot Source is set to Historian. When the timespan of a trend is greater than this number of days, use PARCaggregate plot reduction. Missing periods are filled in based on selected Plot Source.
OPC DA Source Type
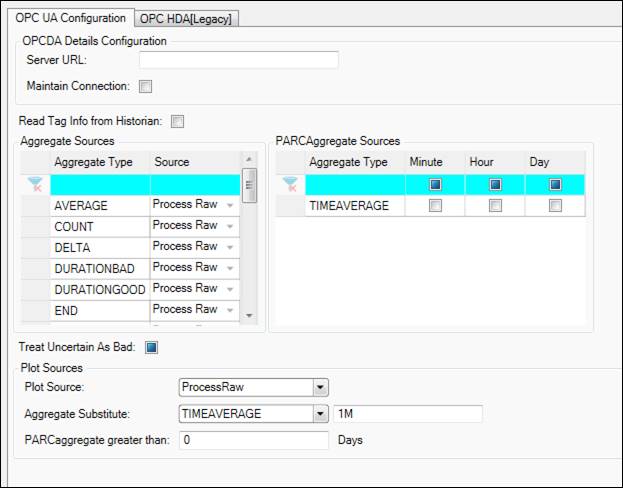
OPCDA Details Configuration
Server URL: Address of OPCDA Server.
Maintain Connection: If checked, after a client connects initially, and then closes all tags/trends that are connected, PARCview will keep the connection open instead of disconnecting. This is used with servers that refuse re-connections until a period of time has passed.
Tag Info
Read Tag Info from Historian: Read tag info from underlying historian instead of Process Tags list.
Aggregate Sources
For an aggregate type, select the source of the calculate statistic: Historian or Process Raw. These aggregates are calculated when requested by the client via tag switch. See Aggregates for more information.
Historian: Return statistic from historian. This assumes the historian stores or can calculate the statistic. If not, it will fall back to process raw.
Process Raw: PARCview client calculates the statistic from raw data.
PARCaggregate Sources
Check off the aggregate types that PARCaggregate will calculate for this source. These aggregates are time-weighted averages calculated over the minutes of the hour, hours of the day, and days of the year. See Aggregates for more information.
Minute: Aligned minute of the hour, e.g. 01:00 to 01:01, 01:01 to 01:02, etc. not including the end time of each interval.
Hour: Aligned hour of the day, e.g. 01:00 to 02:00, 02:00 to 03:00, etc. not including the end time of each interval.
Day: Aligned day of the year, e.g. 01/01/2001 00:00 to 01/02/2001 00:00, 01/02/2001 00:00 to 01/03/2001 00:00, etc. not including the end time of each interval.
Data Quality
Treat Uncertain As Bad: If aggregate produces value of uncertain quality, treat as bad quality for this source.
Plot Sources
Plot Source: Specify source of plot-reduced data set used in Trends.
Historian: Return plot-reduced data set from historian. This assumes the historian stores or can calculate the plot-reduced data set. If not, it will fall back to process raw. Can be set to use PARCaggregate when the timespan exceeds the threshold set in the "PARCaggregate greater than" setting below.
Process Raw: PARCview client calculates the plot-reduced data set from raw data
UseAggregateSubstitute: Use the selected Aggregate Substitute instead of a plot-reduced data set.
Aggregate Substitute: This setting only applies when Plot Source is set to UseAggregateSubstitute. Select a statistic and enter the interval over which it will calculate. Specify the interval as a number followed by a time key letter (S for seconds, M for minutes, H for hours, D for days).
PARCaggregate greater than: This setting only applies when Plot Source is set to Historian. When the timespan of a trend is greater than this number of days, use PARCaggregate plot reduction. Missing periods are filled in based on selected Plot Source.
OPC HDA Source Type
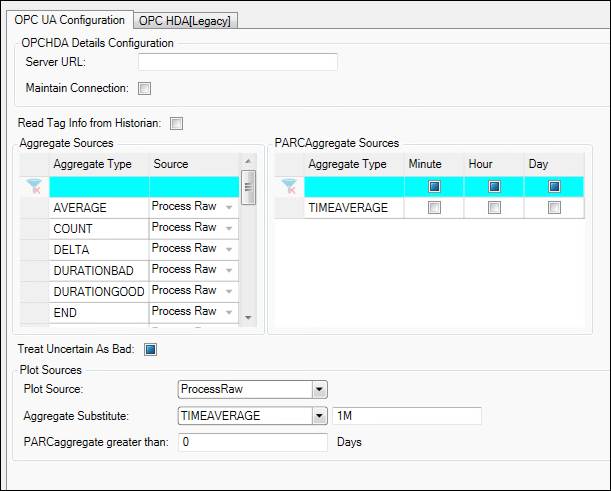
OPCHDA Details Configuration
Server URL: Address of OPCHDA Server.
Maintain Connection: If checked, after a client connects initially, and then closes all tags/trends that are connected, PARCview will keep the connection open instead of disconnecting. This is used with servers that refuse re-connections until a period of time has passed.
Tag Info
Read Tag Info from Historian: Read tag info from underlying historian instead of Process Tags list.
Aggregate Sources
For an aggregate type, select the source of the calculate statistic: Historian or Process Raw. These aggregates are calculated when requested by the client via tag switch. See Aggregates for more information.
Historian: Return statistic from historian. This assumes the historian stores or can calculate the statistic. If not, it will fall back to process raw.
Process Raw: PARCview client calculates the statistic from raw data.
PARCaggregate Sources
Check off the aggregate types that PARCaggregate will calculate for this source. These aggregates are time-weighted averages calculated over the minutes of the hour, hours of the day, and days of the year. See Aggregates for more information.
Minute: Aligned minute of the hour, e.g. 01:00 to 01:01, 01:01 to 01:02, etc. not including the end time of each interval.
Hour: Aligned hour of the day, e.g. 01:00 to 02:00, 02:00 to 03:00, etc. not including the end time of each interval.
Day: Aligned day of the year, e.g. 01/01/2001 00:00 to 01/02/2001 00:00, 01/02/2001 00:00 to 01/03/2001 00:00, etc. not including the end time of each interval.
Data Quality
Treat Uncertain As Bad: If aggregate produces value of uncertain quality, treat as bad quality for this source.
Plot Sources
Plot Source: Specify source of plot-reduced data set used in Trends.
Historian: Return plot-reduced data set from historian. This assumes the historian stores or can calculate the plot-reduced data set. If not, it will fall back to process raw. Can be set to use PARCaggregate when the timespan exceeds the threshold set in the "PARCaggregate greater than" setting below.
Process Raw: PARCview client calculates the plot-reduced data set from raw data
UseAggregateSubstitute: Use the selected Aggregate Substitute instead of a plot-reduced data set.
Aggregate Substitute: This setting only applies when Plot Source is set to UseAggregateSubstitute. Select a statistic and enter the interval over which it will calculate. Specify the interval as a number followed by a time key letter (S for seconds, M for minutes, H for hours, D for days).
PARCaggregate greater than: This setting only applies when Plot Source is set to Historian. When the timespan of a trend is greater than this number of days, use PARCaggregate plot reduction. Missing periods are filled in based on selected Plot Source.
PHD Source Type
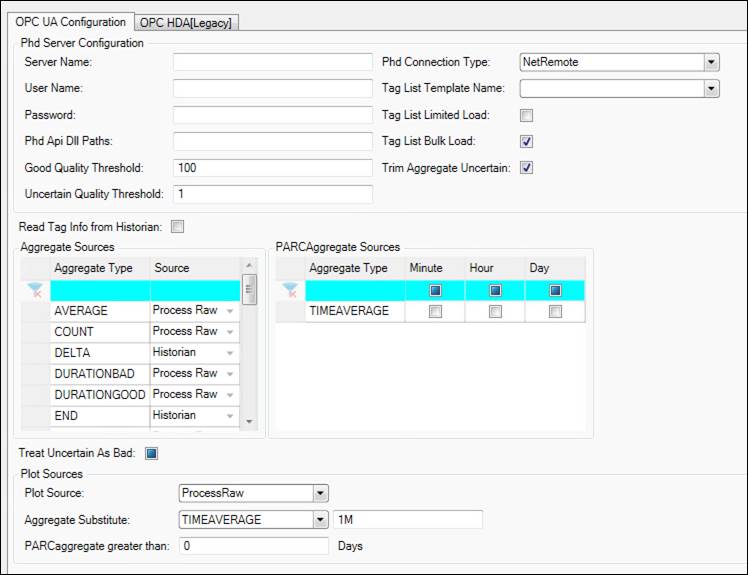
PHD Server Configuration
Server Name: PHD server name.
User Name: Enter user name to log in with, if required.
Password: Enter password for user name.
PHD API dll Paths: Enter location of PHD API .dll files.
Good Quality Threshold: Specifies how PHD quality value should be interpreted. When PHD quality code is greater or equal to this number, point quality will be reported as good.
Uncertain Quality Threshold: Specifies how PHD quality value should be interpreted. When PHD quality code is greater or equal to this number and less than GoodQualityThreshold, point quality will be reported as uncertain. This number can be set to be equal or greater than GoodQualityThreshold when it is desired not to have uncertain quality.
PHD Connection Type: Possible connection types: Com, ComRemote, NetRemote, NetApi200, NetApi150.
Tag List Template Name: Select SQL Tag Template used to retrieve tag list for this source.
Tag List Limited Load: If checked, will load only Name, Description, and Units. When checked, “Tag List Bulk Load” does not apply.
Tag List Bulk Load: If checked, tag properties will be loaded using PHD bulk load functionality, otherwise each tag properties will be read one by one.
Trim Aggregate Uncertain: Specifies whether uncertain and bad quality should be trimmed at the end of the list when aggregation is requested.
Tag Info
Read Tag Info from Historian: Read tag info from underlying historian instead of Process Tags list.
Aggregate Sources
For an aggregate type, select the source of the calculate statistic: Historian or Process Raw. These aggregates are calculated when requested by the client via tag switch. See Aggregates for more information.
Historian: Return statistic from historian. This assumes the historian stores or can calculate the statistic. If not, it will fall back to process raw.
Process Raw: PARCview client calculates the statistic from raw data.
PARCaggregate Sources
Check off the aggregate types that PARCaggregate will calculate for this source. These aggregates are time-weighted averages calculated over the minutes of the hour, hours of the day, and days of the year. See Aggregates for more information.
Minute: Aligned minute of the hour, e.g. 01:00 to 01:01, 01:01 to 01:02, etc. not including the end time of each interval.
Hour: Aligned hour of the day, e.g. 01:00 to 02:00, 02:00 to 03:00, etc. not including the end time of each interval.
Day: Aligned day of the year, e.g. 01/01/2001 00:00 to 01/02/2001 00:00, 01/02/2001 00:00 to 01/03/2001 00:00, etc. not including the end time of each interval.
Data Quality
Treat Uncertain As Bad: If aggregate produces value of uncertain quality, treat as bad quality for this source.
Plot Sources
Plot Source: Specify source of plot-reduced data set used in Trends.
Historian: Return plot-reduced data set from historian. This assumes the historian stores or can calculate the plot-reduced data set. If not, it will fall back to process raw. Can be set to use PARCaggregate when the timespan exceeds the threshold set in the "PARCaggregate greater than" setting below.
Process Raw: PARCview client calculates the plot-reduced data set from raw data
UseAggregateSubstitute: Use the selected Aggregate Substitute instead of a plot-reduced data set.
Aggregate Substitute: This setting only applies when Plot Source is set to UseAggregateSubstitute. Select a statistic and enter the interval over which it will calculate. Specify the interval as a number followed by a time key letter (S for seconds, M for minutes, H for hours, D for days).
PARCaggregate greater than: This setting only applies when Plot Source is set to Historian. When the timespan of a trend is greater than this number of days, use PARCaggregate plot reduction. Missing periods are filled in based on selected Plot Source.
PI Source Type
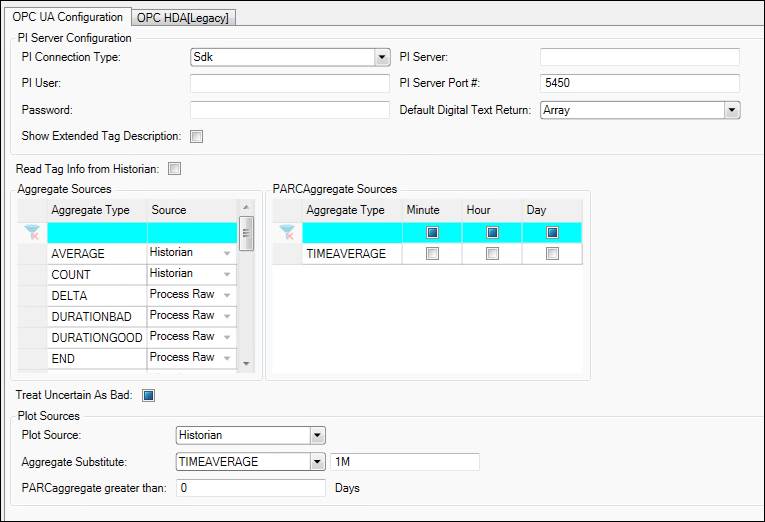
PI Server Configuration
PI Connection Type: API, SDK, or AFSDK. If using an SDK option, the SDK must be installed on the client PC.
PI User: User name for connection, if required.
Password: Password for PI User.
Show Extended Tag Description: Show extended tag description if available.
PI Server: Name of PI server.
PI Server Port #: Port number to use.
Default Digital Text Return: Whether PI digital text tags will return an array of numeric and text values, just numeric values, or just text values.
Tag Info
Read Tag Info from Historian: Read tag info from underlying historian instead of Process Tags list.
Aggregate Sources
For an aggregate type, select the source of the calculate statistic: Historian or Process Raw. These aggregates are calculated when requested by the client via tag switch. See Aggregates for more information.
Historian: Return statistic from historian. This assumes the historian stores or can calculate the statistic. If not, it will fall back to process raw.
Process Raw: PARCview client calculates the statistic from raw data.
PARCaggregate Sources
Check off the aggregate types that PARCaggregate will calculate for this source. These aggregates are time-weighted averages calculated over the minutes of the hour, hours of the day, and days of the year. See Aggregates for more information.
Minute: Aligned minute of the hour, e.g. 01:00 to 01:01, 01:01 to 01:02, etc. not including the end time of each interval.
Hour: Aligned hour of the day, e.g. 01:00 to 02:00, 02:00 to 03:00, etc. not including the end time of each interval.
Day: Aligned day of the year, e.g. 01/01/2001 00:00 to 01/02/2001 00:00, 01/02/2001 00:00 to 01/03/2001 00:00, etc. not including the end time of each interval.
Data Quality
Treat Uncertain As Bad: If aggregate produces value of uncertain quality, treat as bad quality for this source.
Plot Sources
Plot Source: Specify source of plot-reduced data set used in Trends.
Historian: Return plot-reduced data set from historian. This assumes the historian stores or can calculate the plot-reduced data set. If not, it will fall back to process raw. Can be set to use PARCaggregate when the timespan exceeds the threshold set in the "PARCaggregate greater than" setting below.
Process Raw: PARCview client calculates the plot-reduced data set from raw data
UseAggregateSubstitute: Use the selected Aggregate Substitute instead of a plot-reduced data set.
Aggregate Substitute: This setting only applies when Plot Source is set to UseAggregateSubstitute. Select a statistic and enter the interval over which it will calculate. Specify the interval as a number followed by a time key letter (S for seconds, M for minutes, H for hours, D for days).
PARCaggregate greater than: This setting only applies when Plot Source is set to Historian. When the timespan of a trend is greater than this number of days, use PARCaggregate plot reduction. Missing periods are filled in based on selected Plot Source.
Proficy Source Type
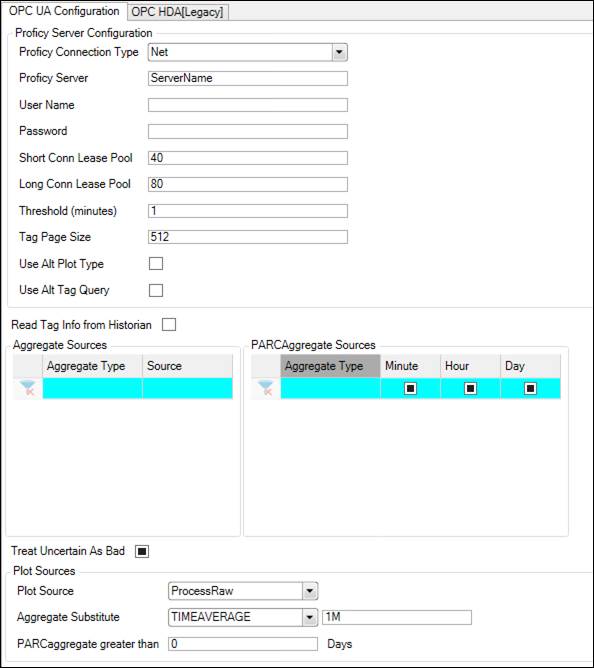
Proficy Server Configuration
Proficy Connection Type: Whether to connect to the Proficy server using the legacy API or newer .Net method.
Api: Use to connect to legacy Proficy servers (version 5 and 6).
Net: Uses the Proficy SDK to connect. Requires Proficy Client Tools installed on the dataPARC server.
Proficy Server: Name of Proficy server.
User Name: User name for connection, if necessary.
Password: Password for user name.
Short Conn Lease Pool: The number of connections to initialize in a pool used for small historical queries, such as retrieving a current value. Recommended value is 40.
Long Conn Lease Pool: The number of connections to initialize in a pool used for large historical queries, such as plotting data on a trend. Recommended value is 80.
Threshold (minutes): This value determines which connection lease pool is used for data requests. If the amount of time in a historical request exceeds this threshold the long connection pool is used. Recommended value is 1 minute.
Tag Page Size: The number of tags to return per response during a Get Tags call.
Use Alt Plot Type: Use alternate plot sample type. For a read process call, if the interpolation type is continuous, it will change the Proficy sample type to InterpolateToRaw, and if the interpolation type is State or Manual, it will change the Proficy sample type to LabToRaw. Recommended value is false.
Use Alt Tag Query: This is used as a workaround for Proficy versions 7 and 7.1. In some cases if this is set to false the Proficy server will not return any tags. Setting it to true will perform an alternate way of retrieving tags that avoids filtering.
Tag Info
Read Tag Info from Historian: Read tag info from underlying historian instead of Process Tags list.
Aggregate Sources
For an aggregate type, select the source of the calculate statistic: Historian or Process Raw. These aggregates are calculated when requested by the client via tag switch. See Aggregates for more information.
Historian: Return statistic from historian. This assumes the historian stores or can calculate the statistic. If not, it will fall back to process raw.
Process Raw: PARCview client calculates the statistic from raw data.
PARCaggregate Sources
Check off the aggregate types that PARCaggregate will calculate for this source. These aggregates are time-weighted averages calculated over the minutes of the hour, hours of the day, and days of the year. See Aggregates for more information.
Minute: Aligned minute of the hour, e.g. 01:00 to 01:01, 01:01 to 01:02, etc. not including the end time of each interval.
Hour: Aligned hour of the day, e.g. 01:00 to 02:00, 02:00 to 03:00, etc. not including the end time of each interval.
Day: Aligned day of the year, e.g. 01/01/2001 00:00 to 01/02/2001 00:00, 01/02/2001 00:00 to 01/03/2001 00:00, etc. not including the end time of each interval.
Data Quality
Treat Uncertain As Bad: If aggregate produces value of uncertain quality, treat as bad quality for this source.
Plot Sources
Plot Source: Specify source of plot-reduced data set used in Trends.
Historian: Return plot-reduced data set from historian. This assumes the historian stores or can calculate the plot-reduced data set. If not, it will fall back to process raw. Can be set to use PARCaggregate when the timespan exceeds the threshold set in the "PARCaggregate greater than" setting below.
Process Raw: PARCview client calculates the plot-reduced data set from raw data
UseAggregateSubstitute: Use the selected Aggregate Substitute instead of a plot-reduced data set.
Aggregate Substitute: This setting only applies when Plot Source is set to UseAggregateSubstitute. Select a statistic and enter the interval over which it will calculate. Specify the interval as a number followed by a time key letter (S for seconds, M for minutes, H for hours, D for days).
PARCaggregate greater than: This setting only applies when Plot Source is set to Historian. When the timespan of a trend is greater than this number of days, use PARCaggregate plot reduction. Missing periods are filled in based on selected Plot Source.
Troubleshooting Proficy Source
If the Proficy ClientAccess Api is denying access to the Proficy historian, it may be due to a setting that only allows the logged-in Windows user to have access to the historian server.
To resolve, look for the App.Config or TestConsole.vshost.exe.config configuration files, which contain this setting:
<appSettings>
<add key="Endpoint" value="WindowsAuthentication"/>
Change this setting to:
<appSettings>
<add key="Endpoint" value="Secured"/>
Sample Source Type
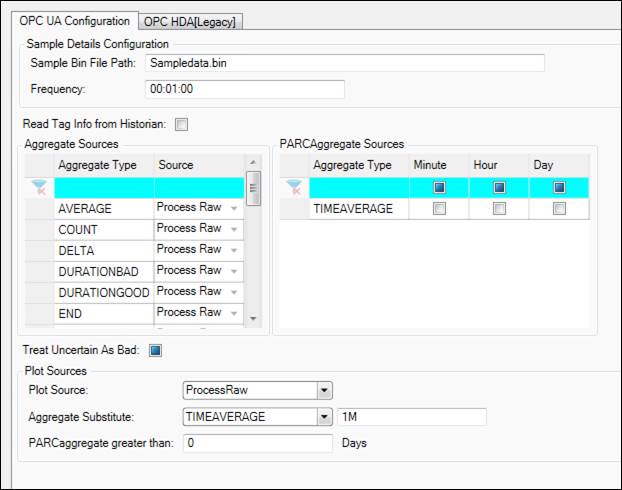
Sample Details Configuration
Sample Bin File Path: Location of .bin file containing sample data.
Frequency: Density of sample data.
Tag Info
Read Tag Info from Historian: Read tag info from underlying historian instead of Process Tags list.
Aggregate Sources
For an aggregate type, select the source of the calculate statistic: Historian or Process Raw. These aggregates are calculated when requested by the client via tag switch. See Aggregates for more information.
Historian: Return statistic from historian. This assumes the historian stores or can calculate the statistic. If not, it will fall back to process raw.
Process Raw: PARCview client calculates the statistic from raw data.
PARCaggregate Sources
Check off the aggregate types that PARCaggregate will calculate for this source. These aggregates are time-weighted averages calculated over the minutes of the hour, hours of the day, and days of the year. See Aggregates for more information.
Minute: Aligned minute of the hour, e.g. 01:00 to 01:01, 01:01 to 01:02, etc. not including the end time of each interval.
Hour: Aligned hour of the day, e.g. 01:00 to 02:00, 02:00 to 03:00, etc. not including the end time of each interval.
Day: Aligned day of the year, e.g. 01/01/2001 00:00 to 01/02/2001 00:00, 01/02/2001 00:00 to 01/03/2001 00:00, etc. not including the end time of each interval.
Data Quality
Treat Uncertain As Bad: If aggregate produces value of uncertain quality, treat as bad quality for this source.
Plot Sources
Plot Source: Specify source of plot-reduced data set used in Trends.
Historian: Return plot-reduced data set from historian. This assumes the historian stores or can calculate the plot-reduced data set. If not, it will fall back to process raw. Can be set to use PARCaggregate when the timespan exceeds the threshold set in the "PARCaggregate greater than" setting below.
Process Raw: PARCview client calculates the plot-reduced data set from raw data
UseAggregateSubstitute: Use the selected Aggregate Substitute instead of a plot-reduced data set.
Aggregate Substitute: This setting only applies when Plot Source is set to UseAggregateSubstitute. Select a statistic and enter the interval over which it will calculate. Specify the interval as a number followed by a time key letter (S for seconds, M for minutes, H for hours, D for days).
PARCaggregate greater than: This setting only applies when Plot Source is set to Historian. When the timespan of a trend is greater than this number of days, use PARCaggregate plot reduction. Missing periods are filled in based on selected Plot Source.
SQL Source Type
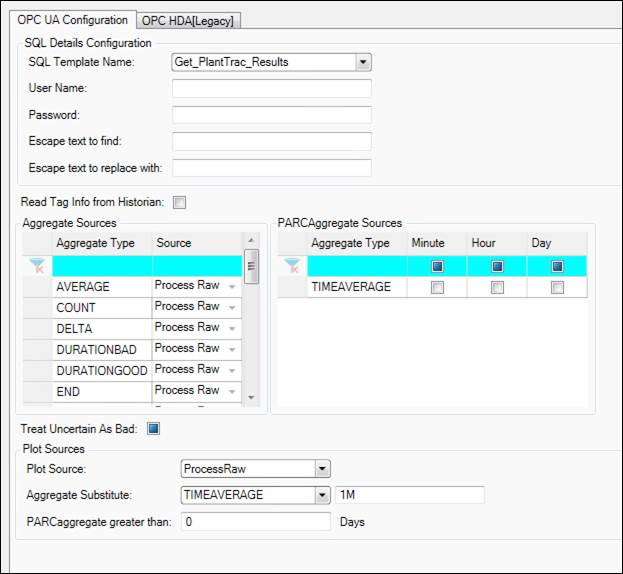
SQL Details Configuration
SQL Template Name: Select name of SQL Tag Template to use.
User Name: User name for connection, if required.
Password: Password for user name.
Escape text to find: Enter text to escape.
Escape text to replace with: Enter replacement for escaped text.
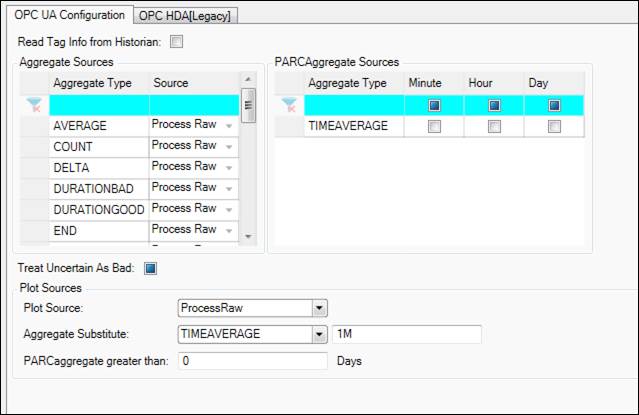
Tag Info
Read Tag Info from Historian: Read tag info from underlying historian instead of Process Tags list.
Aggregate Sources
For an aggregate type, select the source of the calculate statistic: Historian or Process Raw. These aggregates are calculated when requested by the client via tag switch. See Aggregates for more information.
Historian: Return statistic from historian. This assumes the historian stores or can calculate the statistic. If not, it will fall back to process raw.
Process Raw: PARCview client calculates the statistic from raw data.
PARCaggregate Sources
Check off the aggregate types that PARCaggregate will calculate for this source. These aggregates are time-weighted averages calculated over the minutes of the hour, hours of the day, and days of the year. See Aggregates for more information.
Minute: Aligned minute of the hour, e.g. 01:00 to 01:01, 01:01 to 01:02, etc. not including the end time of each interval.
Hour: Aligned hour of the day, e.g. 01:00 to 02:00, 02:00 to 03:00, etc. not including the end time of each interval.
Day: Aligned day of the year, e.g. 01/01/2001 00:00 to 01/02/2001 00:00, 01/02/2001 00:00 to 01/03/2001 00:00, etc. not including the end time of each interval.
Data Quality
Treat Uncertain As Bad: If aggregate produces value of uncertain quality, treat as bad quality for this source.
Plot Sources
Plot Source: Specify source of plot-reduced data set used in Trends.
Historian: Return plot-reduced data set from historian. This assumes the historian stores or can calculate the plot-reduced data set. If not, it will fall back to process raw. Can be set to use PARCaggregate when the timespan exceeds the threshold set in the "PARCaggregate greater than" setting below.
Process Raw: PARCview client calculates the plot-reduced data set from raw data
UseAggregateSubstitute: Use the selected Aggregate Substitute instead of a plot-reduced data set.
Aggregate Substitute: This setting only applies when Plot Source is set to UseAggregateSubstitute. Select a statistic and enter the interval over which it will calculate. Specify the interval as a number followed by a time key letter (S for seconds, M for minutes, H for hours, D for days).
PARCaggregate greater than: This setting only applies when Plot Source is set to Historian. When the timespan of a trend is greater than this number of days, use PARCaggregate plot reduction. Missing periods are filled in based on selected Plot Source.
System Source Type
Tag Info
Read Tag Info from Historian: Read tag info from underlying historian instead of Process Tags list.
Aggregate Sources
For an aggregate type, select the source of the calculate statistic: Historian or Process Raw. These aggregates are calculated when requested by the client via tag switch. See Aggregates for more information.
Historian: Return statistic from historian. This assumes the historian stores or can calculate the statistic. If not, it will fall back to process raw.
Process Raw: PARCview client calculates the statistic from raw data.
PARCaggregate Sources
Check off the aggregate types that PARCaggregate will calculate for this source. These aggregates are time-weighted averages calculated over the minutes of the hour, hours of the day, and days of the year. See Aggregates for more information.
Minute: Aligned minute of the hour, e.g. 01:00 to 01:01, 01:01 to 01:02, etc. not including the end time of each interval.
Hour: Aligned hour of the day, e.g. 01:00 to 02:00, 02:00 to 03:00, etc. not including the end time of each interval.
Day: Aligned day of the year, e.g. 01/01/2001 00:00 to 01/02/2001 00:00, 01/02/2001 00:00 to 01/03/2001 00:00, etc. not including the end time of each interval.
Data Quality
Treat Uncertain As Bad: If aggregate produces value of uncertain quality, treat as bad quality for this source.
Plot Sources
Plot Source: Specify source of plot-reduced data set used in Trends.
Historian: Return plot-reduced data set from historian. This assumes the historian stores or can calculate the plot-reduced data set. If not, it will fall back to process raw. Can be set to use PARCaggregate when the timespan exceeds the threshold set in the "PARCaggregate greater than" setting below.
Process Raw: PARCview client calculates the plot-reduced data set from raw data
UseAggregateSubstitute: Use the selected Aggregate Substitute instead of a plot-reduced data set.
Aggregate Substitute: This setting only applies when Plot Source is set to UseAggregateSubstitute. Select a statistic and enter the interval over which it will calculate. Specify the interval as a number followed by a time key letter (S for seconds, M for minutes, H for hours, D for days).
PARCaggregate greater than: This setting only applies when Plot Source is set to Historian. When the timespan of a trend is greater than this number of days, use PARCaggregate plot reduction. Missing periods are filled in based on selected Plot Source.s