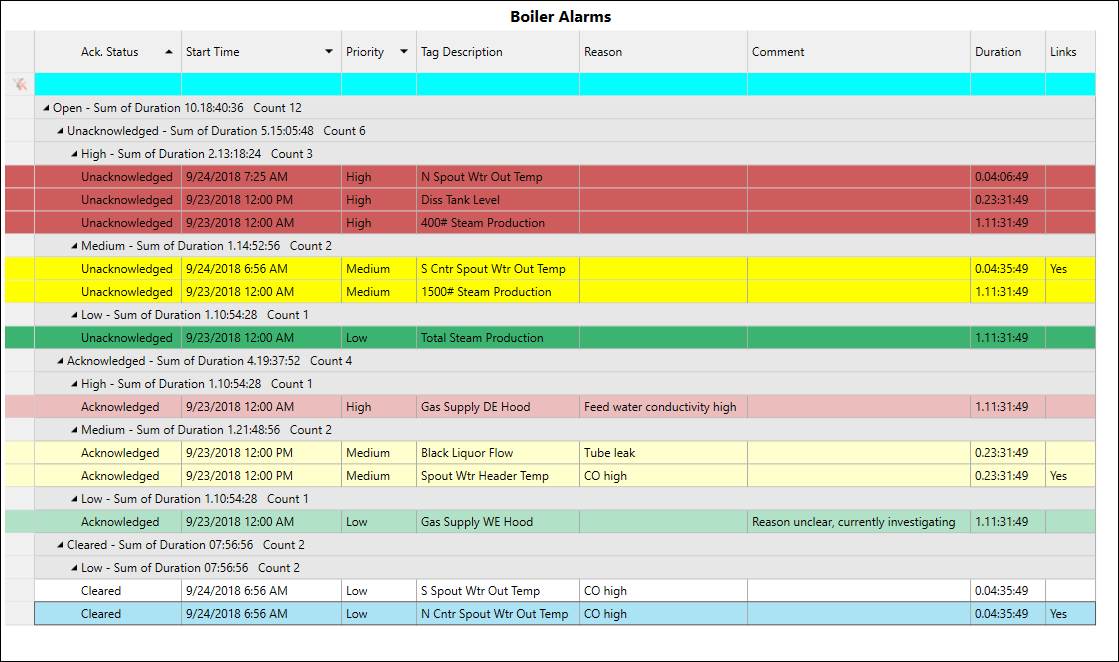
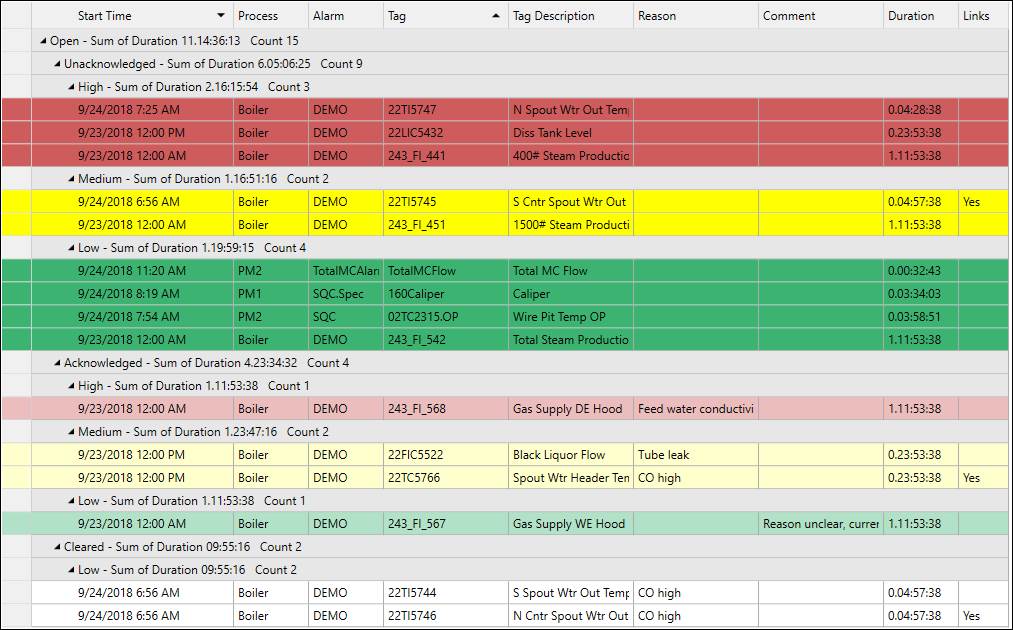
The Alarms Grid shows the alarm events returned based on the display settings. Each row is an alarm event, and the columns are properties of the event. Events can be sorted and grouped by property and color-coded by priority. The list can also be filtered by specific values.
Alarm List displays have a Default Layout. In the Default layout the column sorting and grouping cannot be modified.
Columns
The columns in the Alarms Grid show properties of the alarm events. Columns can be added or removed through the column header right-click menu.
Column Definitions
These are the alarm event properties that can be shown in the grid. Columns can be added or removed through the column header right-click menu.
Ack. Status: Acknowledgment status: Unacknowledged, Acknowledged, or Cleared.
*Start Time: The start time of the event.
End Time: The end time of the event.
State: Alarm state: Open (in-progress) or Closed (ended).
Priority: Alarm priority, High, Medium or Low, based on Alarm Configuration. Priority can affect row coloring if enabled in Configuration.
Locked: Whether or not the alarm event is locked. If locked, the cell contains the text “Yes”. If not locked, the cell is blank.
*Process: The process area associated with the alarm event.
*Alarm: The alarm name.
Type: Source of alarm event.
Grade: The grade name associated with the alarm event, if applicable.
*Tag: Short tag name of the base alarm tag.
UTag: UTag name of the base alarm tag.
*Tag Description: Description of the base alarm tag.
Alarm Description: Description of alarm definition in Alarm Configuration.
*Reason: Reason assigned to the alarm.
*Comment: Comment assigned to the alarm.
*Duration: Total duration of the alarm.
Categories: Any categories that have been assigned to the alarm definition.
Run Name: If using the Run Browser to view alarm events from multiple runs, shows the unique run name.
*Links: Whether or not the alarm definition has linked displays configured. If it has linked displays, the cell contains the text “Yes”. If not, the cell is blank. Linked displays can be opened through the right-click menu.
Limit Side: Which limit bound was exceeded, “U” for the upper limit or “L” for the lower limit.
Limit Value: Value of the limit that was exceeded.
Point Value: Tag value which exceeded the limit.
*Properties with an asterisk(*) are visible in the Default layout.
Column Order
The default column order is: Start Time, Process, Alarm, Tag, Tag Description, Reason, Comment, Duration, Links.
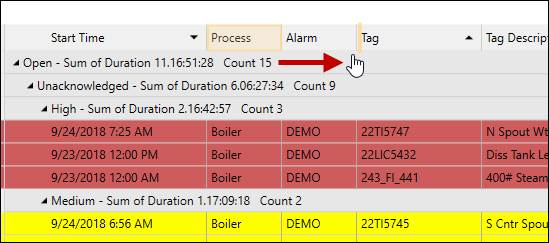
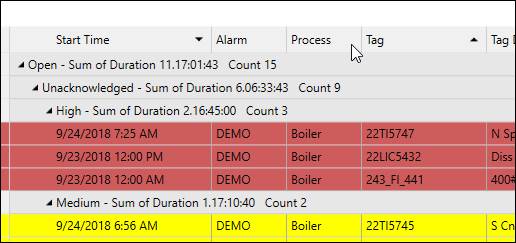
To rearrange columns, click and drag the column header. The column order can be reset through the column header right-click menu.
The rearranged column order will save to the Alarm List display.
Sorting
If the Alarm List display is not in the Default Layout, alarm events can be sorted by property. Click on a column header to sort by that property. Events can also be sorted by grouping.
The default sort order is first by Start Time descending, then by Tag ascending.
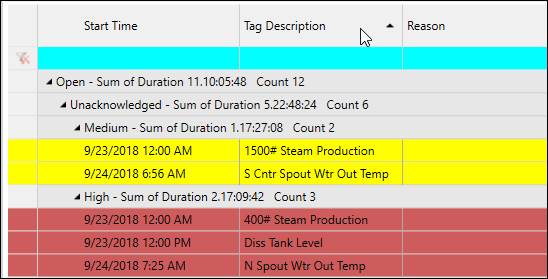
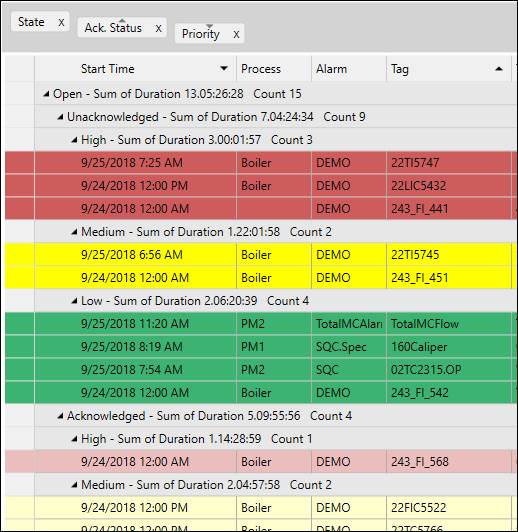
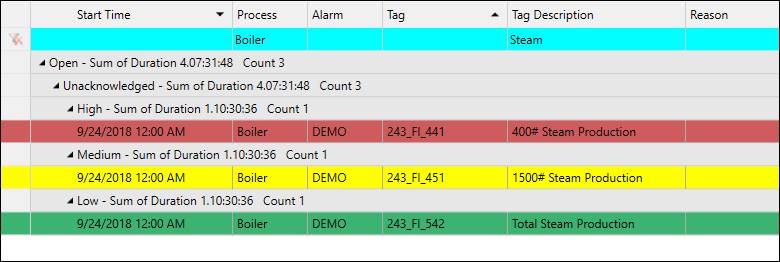
Grouping
If the Alarm List display is not in the Default Layout, the grouping and sorting of alarm events can be modified. Alarm events can be grouped by property by dragging a column into the grouping section above the grid. The order (left to right, high to low) of the properties in the grouping section corresponds to how the events are rolled up in the report. Click and drag properties in the grouping section to rearrange them. To control the sorting of the groups, click on a property in the grouping section.
Each property used for grouping has a group row header that shows a summary of the events within the group. Groups can be expanded and collapsed by clicking on the group header row.
The default grouping is first by State, then by Acknowledgment Status, then by Priority. The groups are first sorted by Acknowledgment Status ascending (Unacknowledged, Acknowledged, Cleared), then by Priority descending (High, Medium, Low).
Filtering
If Auto Refresh is disabled, the alarms grid can be filtered by column values. Enter filter values in the blue filter row.
Column Header Right-Click Menu
Right-click a column header to open the context menu.
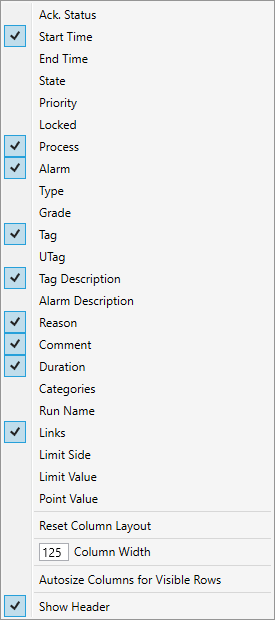
Column names: Check a column name to show that column in the alarms grid. See Column Definitions for descriptions.
Reset Column Layout: Return column layout to default.
Column Width: Set a fixed width for the selected column.
Autosize Columns for Visible Rows: Make all columns nicely accommodate the visible information.
Show Header: Whether to show or hide the column header row. This option is also available in the alarms grid right-click menu.
Alarm Event Acknowledgment
Users can respond to, or acknowledge, alarm events from an Alarm List by entering information associated with the event, such as a reason code, a piece of equipment, or a text comment. Alarm events are acknowledged in the Edit Alarm.
Alarm events have three stages of acknowledgment:
Unacknowledged: The event has not been responded to by the user.
Acknowledged: The alarm’s acknowledgment criteria have been met.
Cleared: The alarm’s clearing criteria have been met.
Acknowledgment and closing criteria can include whether or not a reason, a comment, equipment, or evidence has been assigned, as well as whether the event has ended or been saved. See Alarm Acknowledgement Logic for more information.
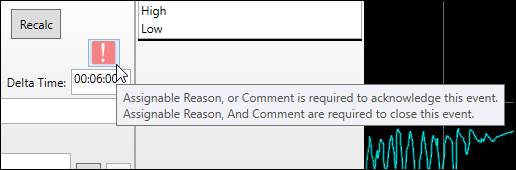
Acknowledgment Warning
In Edit Alarm, if the event is in the open or acknowledged state, a red exclamation point warning icon will alert users that acknowledgment (or further acknowledgment) is required. Hover over the icon to see a message that describes the outstanding acknowledgment items.
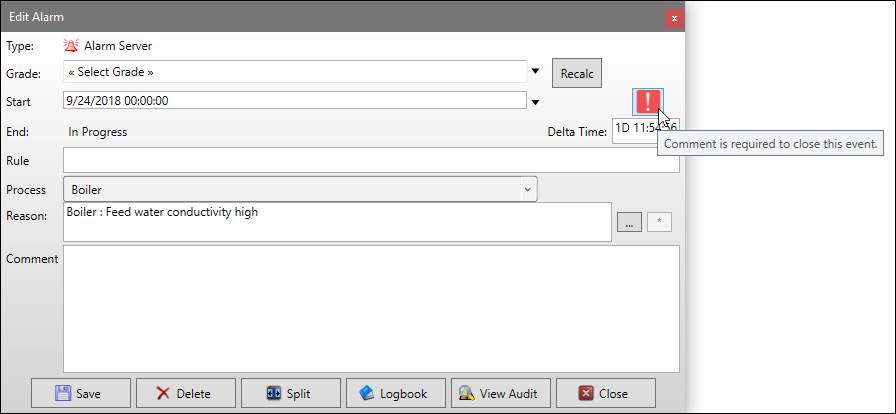
Edit Alarm
To open the Edit Alarm window, double-click a row in the alarms grid or select the context menu option.
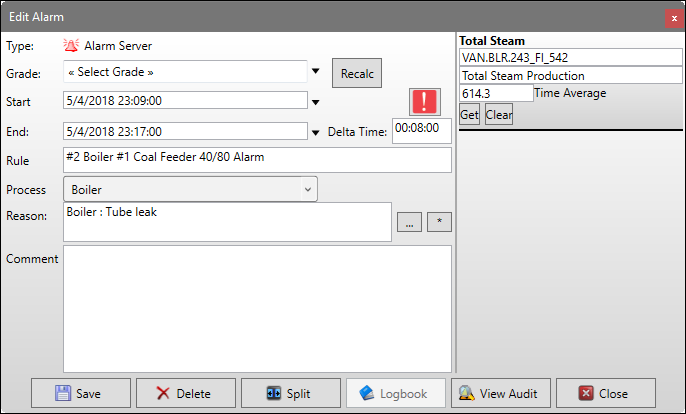
Type: The alarm event type.
Grade: In the drop-down menu, the grade assigned to the alarm event can be modified. This value is automatically populated with the value from the grade tag of the base tag’s process area at the start of the alarm event.
Recalc : Recalculates the grade value and assigns the active grade from the time of the event.
Start Time: The start time of the alarm event. Open the drop-down to use the date-time picker to modify the time.
End Time: The end time of the alarm event. Open the drop-down to use the date-time picker to modify the time.
Delta Time: The duration of the alarm event.
Rule: The SQC rule or description of Alarm that was violated to create the event. The rule cannot be edited. Most tag limits only use the “outside” rule, but additional SQC rules can be configured in Tag Limits.
Process: By default the Tag’s process area will be displayed in this field. Changing this field will affect the alarm’s process area for reporting purposes. For example, events may be categorized by sub-process areas.
Reason: Picking a reason from the pre-defined reason tree assigns a cause to the event.
Ellipsis Button: Opens the Reason Selector.
Asterisk Button: Applies the last chosen reason to the alarm event.
Comment: Typing a comment into the text box allows the user to add more information about the event.
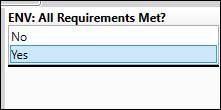
Evidence Panel: If evidence has been configured either for the selected reason or for the alarm definition, the evidence panel will appear. For tag-based evidence, the configured aggregate will be calculated automatically, though it can be recalculated if the event duration changes. For pick list-based evidence, click on the evidence values to apply.
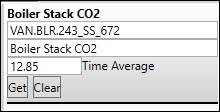
Get: Recalculate aggregate.
Clear: Clear evidence value.
Split: Opens the Event Split Time window, where alarm events can be split into two consecutive events with different cause assignments.
Save: Save all changes to the database. If editing a calculated alarm event, this will save the event to the database as a manually created event.
Logbook: If the process area of the tag in alarm has been configured to create Logbook entries when alarm events are acknowledged, click this button to preview, modify, or save the Logbook entry. This button is disabled if the auto-propagation is not configured or if a reason or comment has not been entered. If the process area’s Logbook Entry Mode is set to Manual, the user must save the entry separately, whereas if the Entry Mode is set to Auto, the entry will be created when the alarm event is saved with a reason and/or comment.
View Audit: Opens a window showing a history of changes made to the alarm event.
Acknowledgment Warning: If the event is in the open or acknowledged state, a red exclamation point warning icon will alert users that acknowledgment (or further acknowledgment) is required. Hover over the icon to see a message that describes the outstanding acknowledgment items.
Reason Selector
Use the Reason Selector to assign a cause to an alarm event from the reason tree. Click the arrow icons to collapse and expand branches of the reason tree. Reasons with red flag icons next to their names are assignable reasons, while reasons with no icon cannot be selected.
The reasons can be filtered by category. The Reason Selector may only show a specific branch of the reason tree based on the process area settings of the tag in alarm.
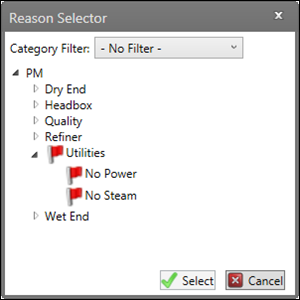
Category Filter: Open the drop-down menu to filter the reason tree by a category. Reasons are assigned to categories in System Configuration.
Select: Apply the selected reason to the alarm event.
Cancel: Close window without applying reason.
Event Split Time
Alarm events can be manually split into two consecutive events with different cause assignments. If the original event had a reason and/or comment assigned, both events will inherit the assignment, but the reason and comment can be manually changed.
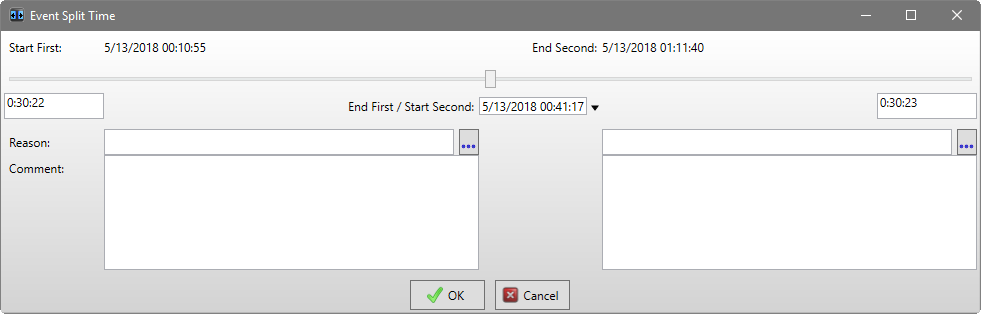
Start First: The start time of the first event.
End Second: The end time of the second event.
Slider: Drag the slider to manually adjust the split time between the two events.
First Duration: The duration of the first event.
End First / Start Second: The split time. Open the time picker or type in the field to manually set the split time.
Second Duration: The duration of the second event.
First Reason: The reason assigned to the first event.
Ellipsis Button: Opens the Reason Selector.
First Comment: The comment assigned to the first event.
Second Reason: The reason assigned to the second event.
Ellipsis Button: Opens the Reason Selector.
Second Comment: The comment assigned to the second event.
OK: Apply changes.
Cancel: Close window without applying changes.
Display Links
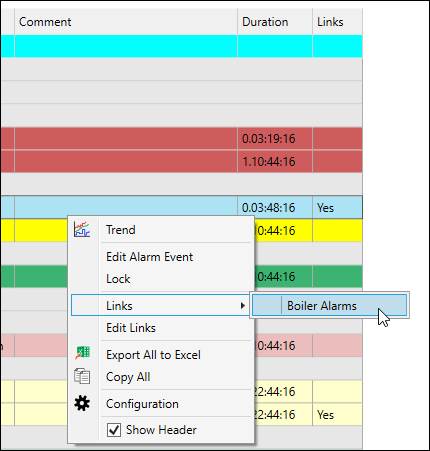
Alarm definitions can be configured with display links so that users can quickly get to specified display files, such as process or area overviews, or alarm SOPs. If alarms have display links configured, the text “Yes” will appear in the Links column. Right-click the alarm row and select Links to see the linked display names. Select a name to launch the display.
Select Edit Links to configured display links directly from the alarm list.
Edit Display Links
Use the Edit Display Links window to configure linked displays for an alarm. Start typing in the new item row (*) to create a new link.
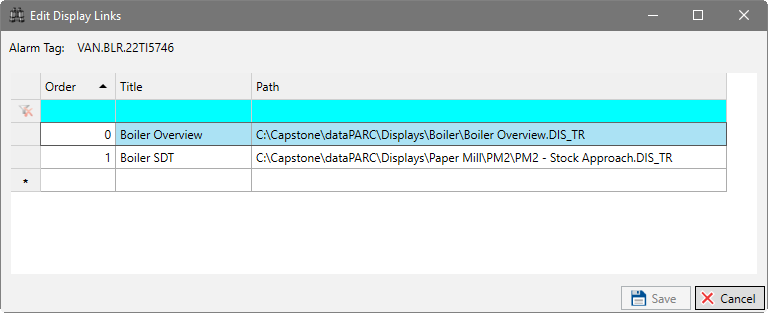
Alarm Tag: The base tag of the alarm definition.
Order: The sort order of the display link in the alarm list grid right-click menu.
Title: Label of the display link in the alarm list grid right-click menu.
Path: Location of the linked display. Click the ellipsis button (…) to launch a file browser. Note: all clients who will open the display must have access to this path.
Save: Save all changes.
Cancel: Close window without saving changes.
Edit Display Links Right-Click Menu
Right-click a row to open the context menu.
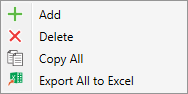
Add: Selects the new item row.
Delete: Marks the selected row for deletion. Click save to finalize the deletion.
Copy All: Copy all to clipboard.
Export All to Excel: Export the grid to an Excel file.
Alarms Grid Right-Click Menu
Right-click a row in the alarms grid to open the context menu.
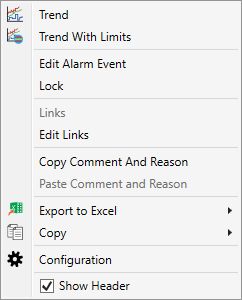
Trend: Launches a trend of the base alarm tag for the duration of the event.
Trend With Limits: Launches a trend of the base alarm tag for the duration of the event with all available limits enabled.
Edit Alarm Event: Opens the Edit Alarm window, where alarm events can be acknowledged.
Lock: Locks the alarm event. Locked events cannot be edited. If locked, this option is checked off. Select it again to unlock the alarm event. Unlocking an alarm event requires the system configuration password or corresponding PARCsecurity role.
Links: Click or hover to see any configured linked displays. Click a linked display to launch it.
Edit Links: Configured linked displays in the Edit Display Links window.
Copy Comment and Reason: Copy entered comment and/or reason to the clipboard.
Paste Comment and Reason: Paste in comment and/or reason.
Export to Excel: Export selected entries or all entries to Excel.
Copy: Copy selected entries or all entries to the clipboard.
Configuration: Open alarm list Configuration. If the Only Alarm Configurator Can Edit Config option is enabled, the user must enter the PARCalarm Configuration password or have the corresponding PARCsecurity role.
Show Header: Whether to show or hide the column header row.