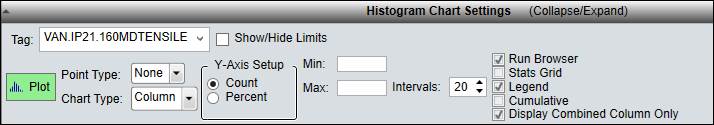
To further refine how histograms are configured to display tag data, use the collapsible Chart Settings panel at the top of the display.
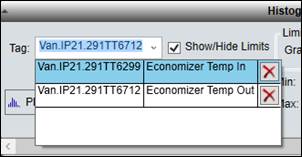
Tag: To add tags to a histogram, drag them from the Tag Browser or other displays onto the chart area or the tag field. To switch the currently selected tag, open the drop-down menu and select a different tag. All of the tags added to the histogram are available in the menu. Click the red “X” to remove a tag.
. Limits: Histograms can show SQC limits that have been configured for tags. To enable limits check Show/Hide Limits.
Select the Grade and Limit Type from the drop-down menus.
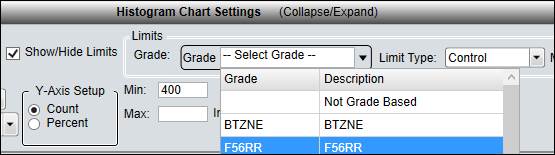
The histogram draws the tag limits as vertical lines. The limit values and a key to the limit line colors are shown in the Legend.
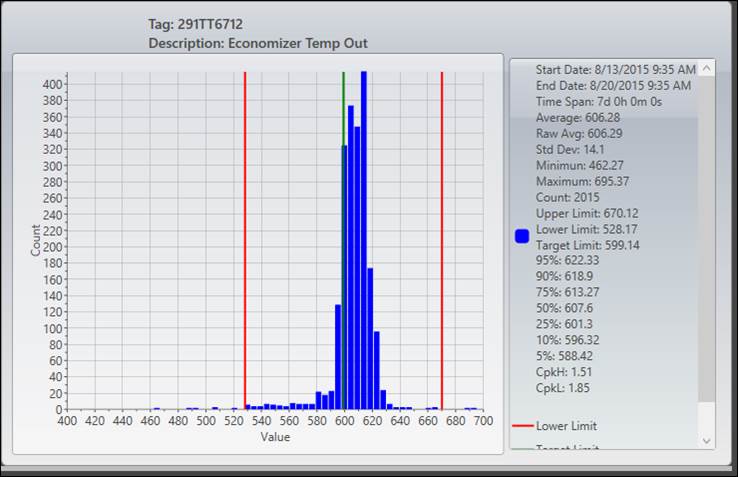
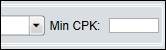
Enter a Min CPK, if desired, for calculating the CpkH and CpkL.
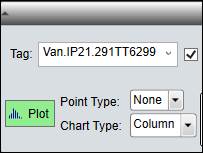
Plot: Click the Plot button to retrieve tag data based on the histogram’s current settings. If changes to the histogram’s settings require the data to be re-plotted, the button will glow green.
Point Type: Select how the Y-Value for each X-Value in the histogram is displayed.
Chart Type: Choose between a column-based chart and a line-based chart.
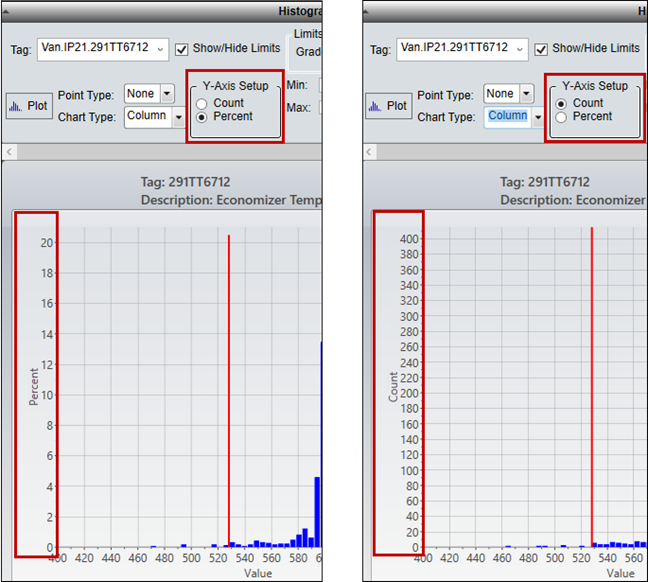
Y Axis Setup: Configure the histogram’s Y-axis to show the distribution of values by the number of data points within each interval ( Count) or by the percentage of data points within each interval ( Percent).
Min/Max: Filter out values using the Min and Max fields. Enter the minimum or maximum values to include.

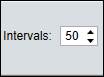
Intervals: Histograms show the distribution of tag values over a certain number of intervals between the minimum and maximum values. To change the number of intervals, use the up and down arrows or enter a value manually.