Interpolation types for each tag are selected in the Interpolate drop-down menus in row 9. Tags can be repeated in row 1 with different interpolation types to display different aggregates of the same tag.
TimeAvg*: Time weighted average of the tag over the step size.
TimeAvg2*: Same as TimeAvg but does not carry forward the last known good quality point across a bad quality timespan.
Avg*: Arithmetic average of the tag over the step size.
Linear: Linearly interpolates the tag’s value at the time step.
Manual: If Data type is set to manual, this will return raw data for the tag.
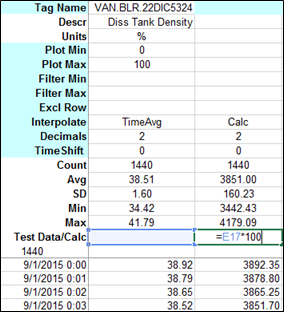
Calc: Takes the calculation built in that column’s row 17 (Test Data/Calc) and copies it down to all the cells in that column where there is data. A custom calculation can be made in that row that uses other tag’s values and it will be copied down to the cells. No Tag Name needs to be entered in the first row. See below for more.
Count: The count of the actual values of the tag over the step size.
SD: The standard deviation of the tag over the step size.
Min: The minimum value of the tag over the step size.
Min2: Same as Min except it includes interpolated bounding values.
MinAtTime2: The Min value and the timestamp.
Max: The maximum value of the tag over the step size.
Max2: Same as Max except it includes interpolated values.
MaxAtTime2: The Max value and the timestamp.
Total: The TimeAvg aggregate multiplied by the step size in seconds.
Total2: The TimeAvg2 aggregate multiplied by the step size in seconds.
Sum: The sum of all the actual values of the tag over the step size.
Start: The first value of the tag over the interval.
End: The last value of the tag over the interval.
DurationGood: The duration of the time interval, in seconds, that the quality of the tag was good.
DurationBad: The duration of the time interval, in seconds, that the quality of the tag was bad.
PercentGood: The percent of the time interval that the quality of the tag was good.
PercentBad: The percent of the time interval that the quality of the tag was good.
State: Treats the tag as a state tag and the values only change if they actual change in history. It flat lines the tag between points.
*the –Qual option for these interpolation types returns the quality number for that interpolation type. If the Decimals row (row 10) is set to text, this will bring back the text string for the quality.
One of the interpolation types is Calc, and is used to make a column a calculated column. A formula/equation can be put in the Test Data/Calc cell (row 17) of a column, and this formula will be copied down the column when Get or Filt are clicked. The Calc column is treated like a actual tag column- the Stats rows are filled in, Filters can be applied to it, it can be trended by clicking the ‘Chrt” button and it can be used to Exclude Rows. The Normalized sheet will always copy the formula down the same length as all of the other tags. Clicking the Filt button will fill a new Calc column and recalc existing columns without retrieving new data, as the Get button would.