Enter Filter values into rows 6 and/or 7 ( Filter Min and Filter Max) to define the filter for that column of data. Click Get Data or Filter to apply the filter to the data. The filter leaves data in the cells, but changes the data outside the range to text so that it will not be included in the statistics (average, standard deviation, etc.) found at the top of each column.
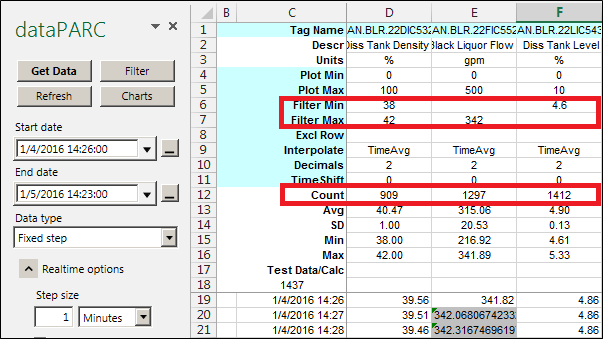
The Count of values is lower in the columns with filters applied.
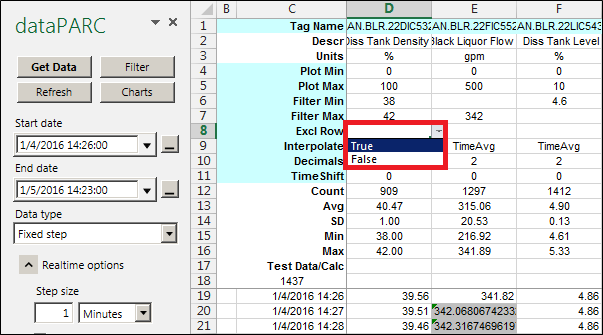
Row 8 underneath the tags is the Excl Row option (Exclude Rows). Setting it to True will use this column’s filter criteria to filter the entire row. This is useful for key process tags because all other tags will be excluded at time stamps that exceed the filter criteria of any tags with Excl Row set to True. Click the Get Data or Filter button to apply the settings to the sheet. It is possible to have muliple columns with Excl Row set to True.