Purpose: Learn to filter data in a Histogram and change the number of intervals (columns).
Task: Open or create a Histogram chart and filter out all data greater than a specified value. Increase the number of intervals.
Steps:
Open or create a Histogram chart.
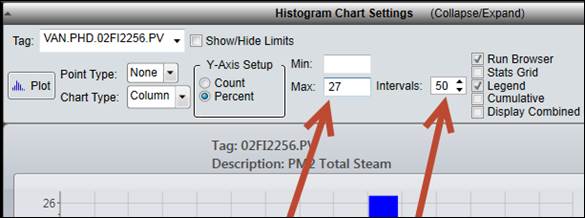
Enter a filter value in the Max field. Click Plot to filter the data.
Increase the number in the Intervals field. Click Plot.