Data-driven optimization starts at the plant-floor, with operations staff utilizing real-time data visualization and analysis tools to make minute-by-minute decisions to reach very specific targets on individual equipment or production lines. However, data systems should also provide insight into broader, longer-term performance metrics for multiple sites or production lines across an entire enterprise. The analysis question is elevated from “how do I most efficiently operate a piece of equipment” to “which processing lines are most profitable”? Organizations may wish to compare multiple similar process units to each other, or monitor overall process performance over a long period of time.
Enterprise-wide Analysis Prerequisites
Several facets of data infrastructure must be in place prior to leveraging enterprise-wide analysis tools.
Standardized Data Platform
All of an enterprise’s operation sites and production lines must speak the same “data language” prior to developing inter-unit calculations. This does not mean that all sites must use the same control system vendor or even the same process data historian. dataPARC serves as a vendor-agnostic platform where data from all sources throughout an organization can be integrated seamlessly, enabling cross unit analysis without time-consuming data export/import efforts. For more information on dataPARC Corporate Architecture options, please refer to this article: dataPARC Corporate Architecture Best Practices
Connectivity
Reliable wide-area network connectivity is another must when setting-up enterprise-wide data analysis. dataPARC application servers at each site must be able to communicate with each other. However, this does not necessarily mean that all users at one site will have full access to all sites - data access across sites can be restricted using role-based permissions settings in PARCsecurity. If desired, access can be limited to only those responsible for multi-unit optimization.
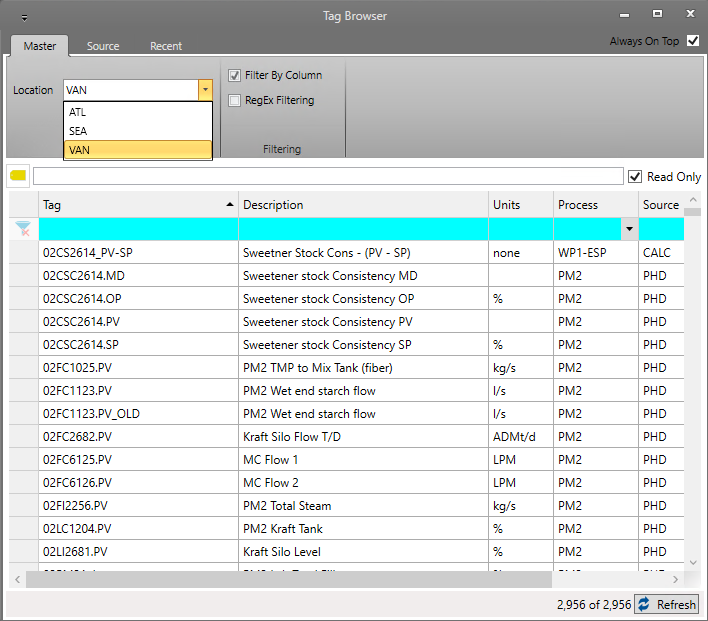
Cross-connection between sites is accomplished using dataPARC’s “Location” configuration which links one dataPARC application server to others within the organization. The Tag Browser example below shows a system with three Locations configured: ATL, SEA, and VAN. Note that data from all three locations can be accessed using the same server connection and login on the PARCview client (if permissions are allowed).
Centralized Management
Calculation of KPIs and visualization of inter-site results are typically best managed by a centralized team. This may be handled by corporate resources, or perhaps assigned to individuals at a specific operating site or unit. In either case, they should be empowered to set standards and implement them across the entire enterprise.
Standardized Data Aggregation
A company may operate production lines across many regions and time zones. A standard basis for local data aggregation should be established (production day, shift, fiscal year, etc.) so that all sites are synchronized and comparing “apples-to-apples”.
Performance Metric Calculation
Within dataPARC, several approaches to enterprise-wide performance calculation can be utilized. Which method is best will depend on a company’s structure and goals.
Asset Hub
dataPARC’s Asset Hub facilitates implementation of a tree-style structure of asset types. Properties are defined for each asset type, and mathematical expressions can be entered for calculation of property values. These expressions can utilize references to other property values within the asset type, and will be applied to all asset instances belonging to that type. In the simplified example below, an asset type called “ProductionLine” contains three custom properties: Efficiency, Speed, and PowerInput. Speed and PowerInput will reference historian tags specific to each asset instance, but Efficiency will be calculated using a formula automatically applied to all instances of ProductionLine.

By implementing the same asset type structure at all sites, standardized key performance indicators (KPIs) can be calculated for process areas, production lines, and other common asset types. The results of these can then be incorporated into reports or analysis elements that encompass the entire enterprise.
Common Calculated Tag Formulas
For calculations better performed outside the Asset Hub structure, dataPARC’s Script Editor can utilize saved formulas. These formulas can be re-used for similar process unit or site-wide KPI calculations, altering only the tag links for input arguments relative to each application. The example below shows an accumulator formula. In the example case, the amount of coal consumed is accumulated for each production batch. This formula can be re-used for any accumulator function by creating Calc tags with various tag references for the ResetEventTag and RawDataTag arguments.
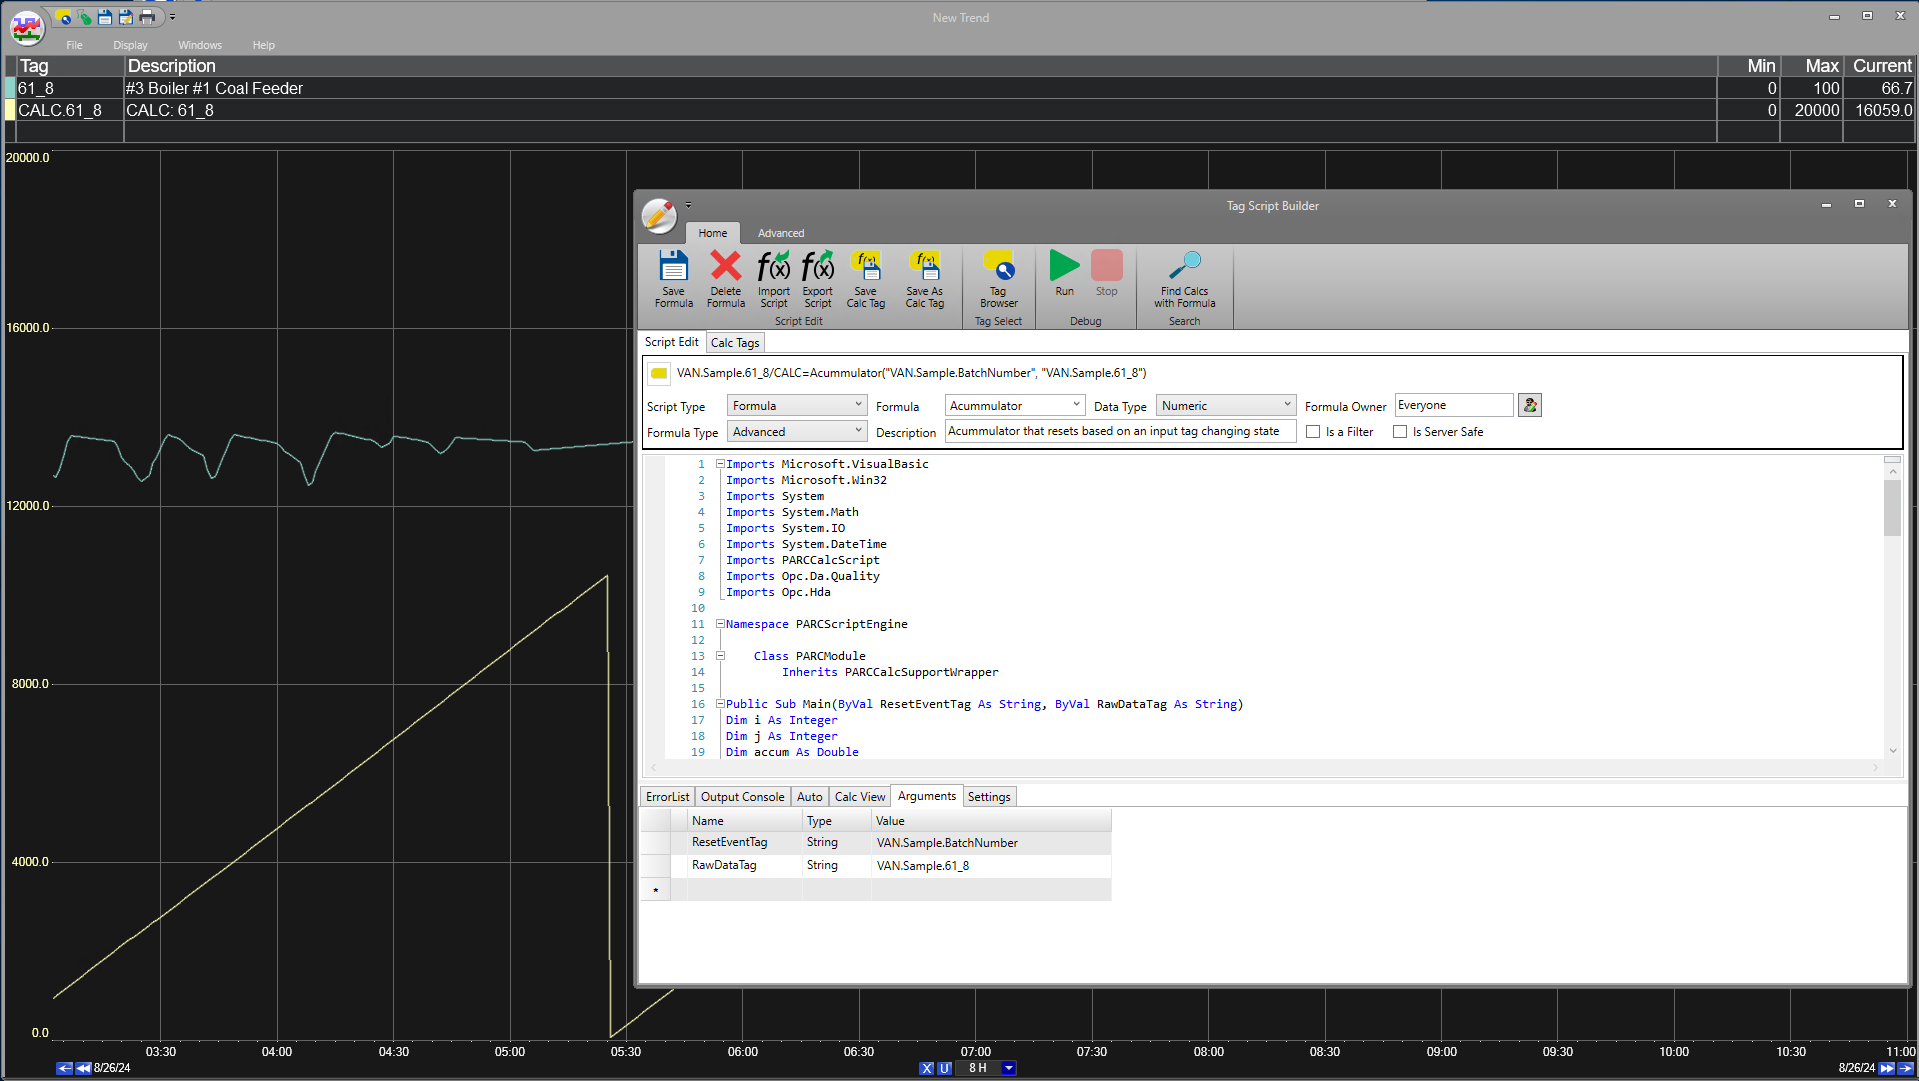
Note the “Import Script” and “Export Script” buttons in the Home menu of the Script Editor above. These allow Formulas developed at one site to be easily saved and deployed at other sites, ensuring standardization of calculation methods throughout an enterprise.
Historized Scripted Tags
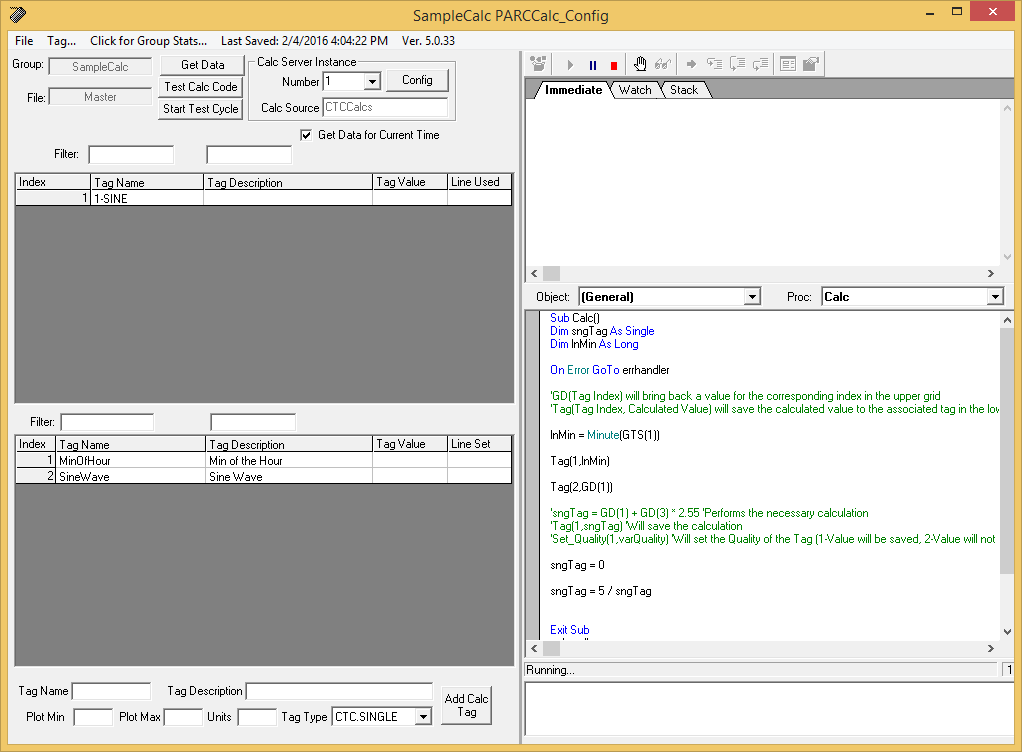
If common calculations are desired to be stored to history, historized calculation scripts can be written and deployed across multiple sites or production lines. The script programs themselves are simply text code, and can be copied/pasted into text files and implemented on various dataPARC Servers. The Input Tags and Output Tags grids can also be copied to the clipboard to facilitate reproduction in another instance.
Advantages include:
Improved performance when extracting data for aggregate calculations, since calculation results are already stored in history.
Historical record of any previous calculation results is retained.
Disadvantages include:
Changes to input references or calculation methods are not automatically applied to historical results (a backfill is required).
Additional server storage is required for long-term data retention.
PCA Modeling
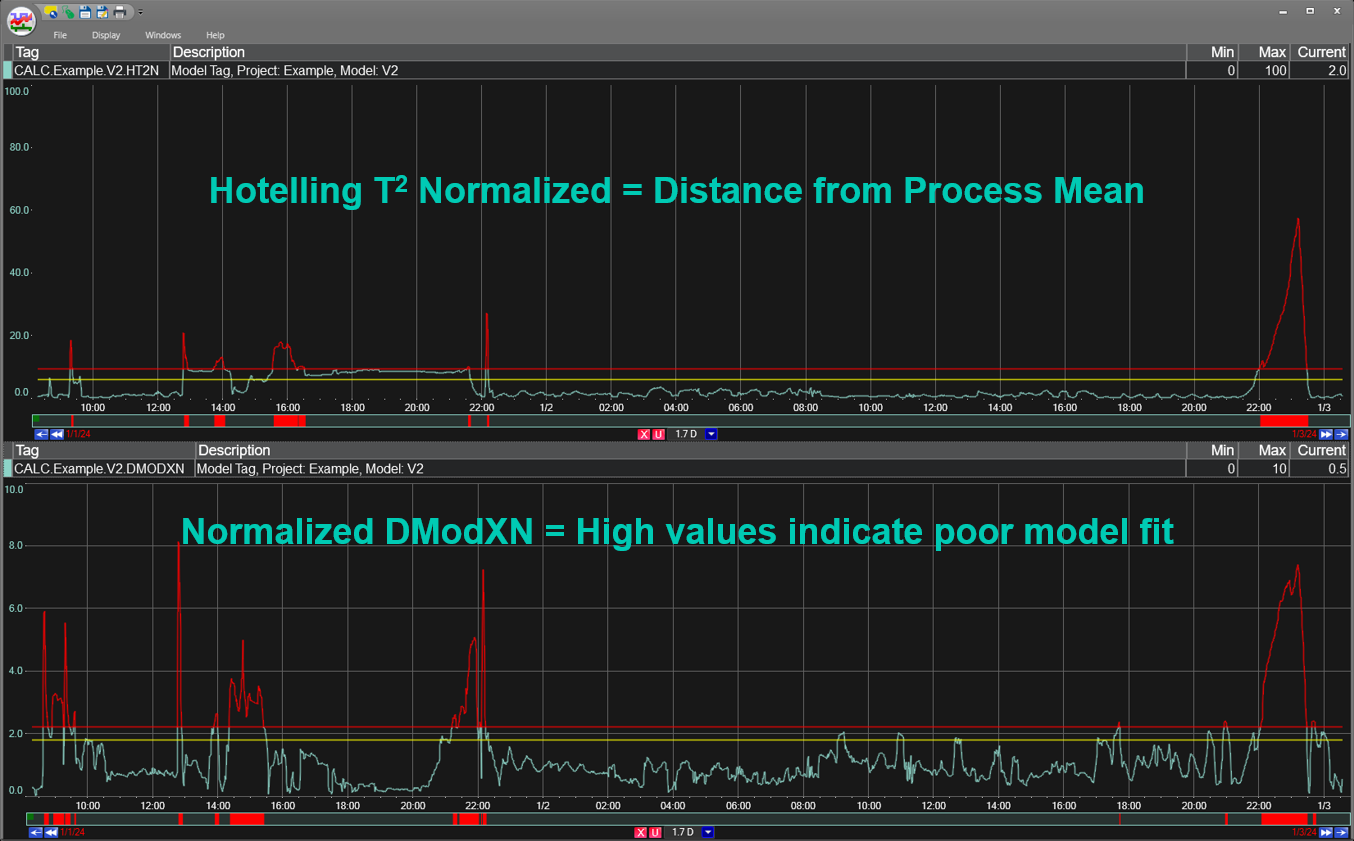
Principle Component Analysis (PCA) modeling provides a means of distilling a large amount of data down to a few key statistics that provide insight into the state of the process. Using dataPARC’s optional PARCmodel feature, a “training period” of data from a list of key input parameters are fed into the model identification engine to define “normal operation”. Once online, the model continuously calculates statistics which are indicative of the state of the process. The trend display below shows an example of the two primary statistics provided by a PCA model - together they indicate if the process is operating near its “normal” state, and if it is responding as the model expects it to. PCA modeling can be applied to an entire plant site or production line to facilitate enterprise-level monitoring of overall process health.
Enterprise-Wide Data Visualization/Notification
Standardized performance metrics are only useful if results from multiple sites or production units can be presented in a meaningful way. dataPARC offers a range of visualization tools as well as event notification options to maximize the value of this data at the corporate level.
Enterprise-Wide Dashboards
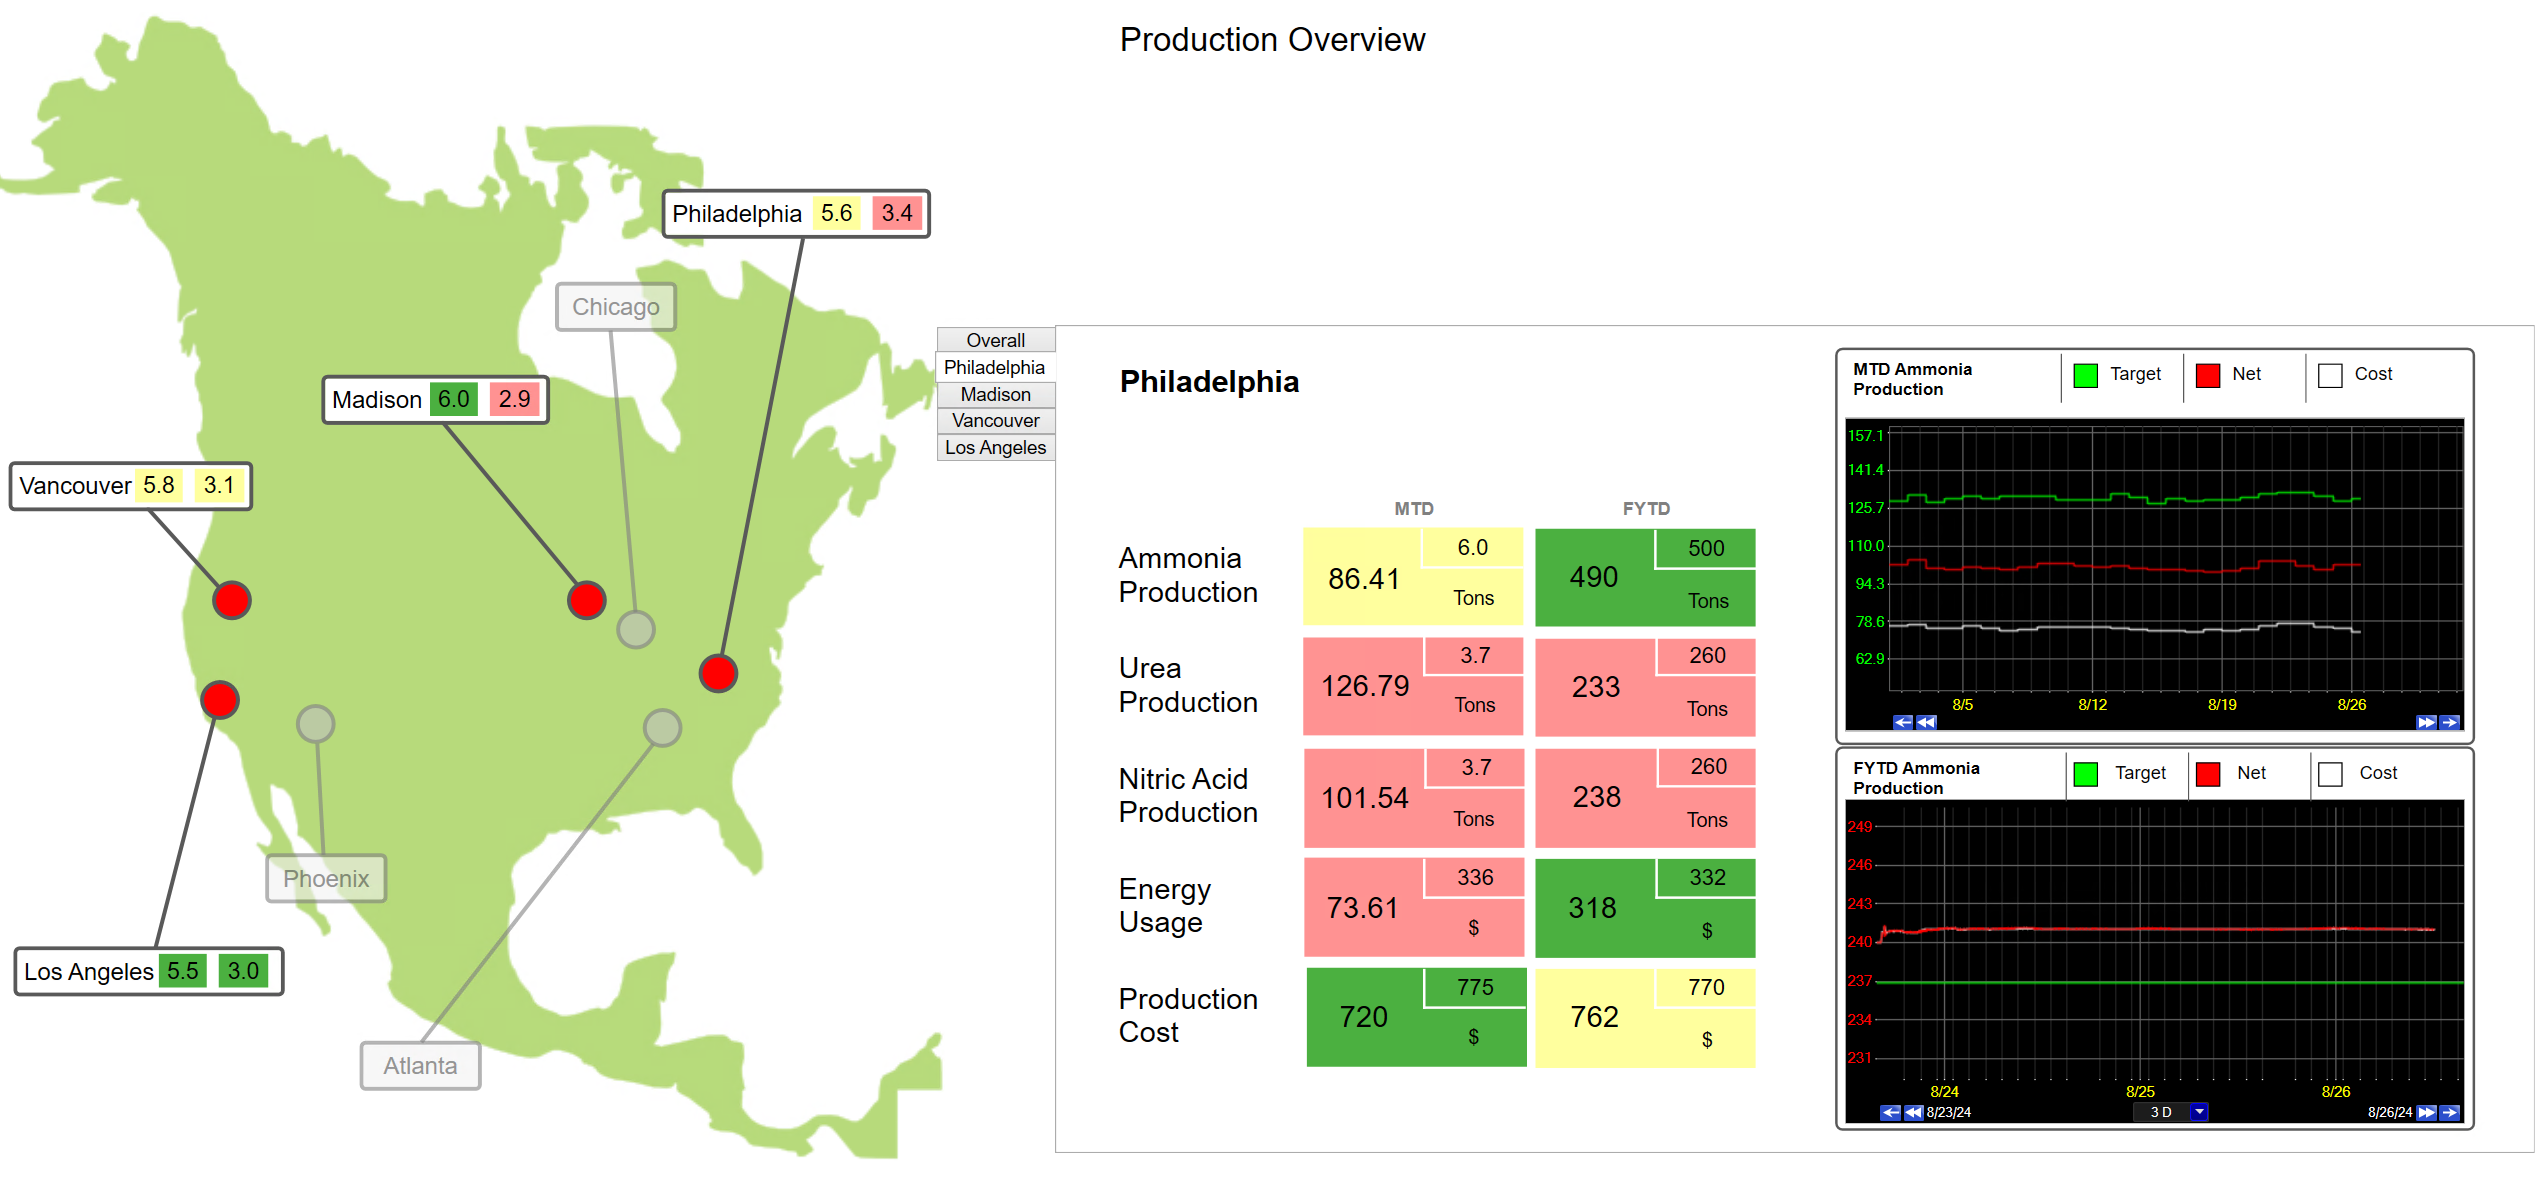
Current data, statistical aggregates, trends, and more can be included in PARCgraphics displays encompassing an entire enterprise. The example below illustrates five KPIs at four different production sites, each displaying monthly and annual aggregates along with trend displays of cost calculations. The tabbed frame toggles the statistical view between each location.
Corporate Reports
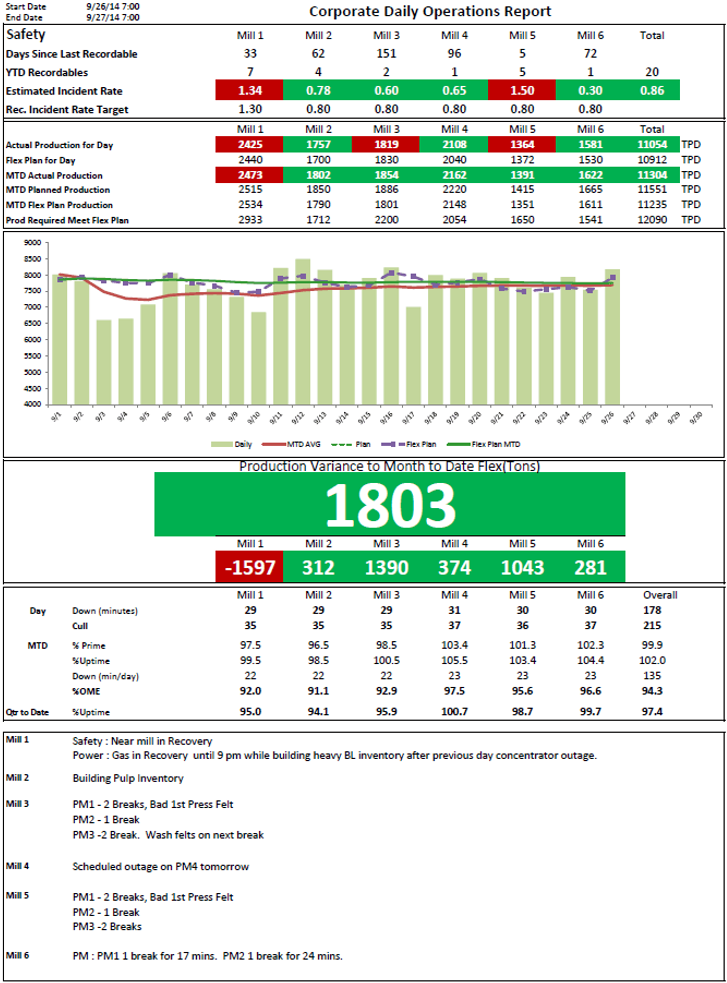
Periodic, automatically generated reports can also include data from multiple operating sites. This is possible using PARCgraphics image style reports (similar to above), Excel reports with the PARCview Excel Add-In, or PARCreport Designer. The Excel report example below includes top-level KPIs for an enterprise consisting of six mills. Performance of each individual mill is shown along with total corporate results.
Multi-Unit Centerline
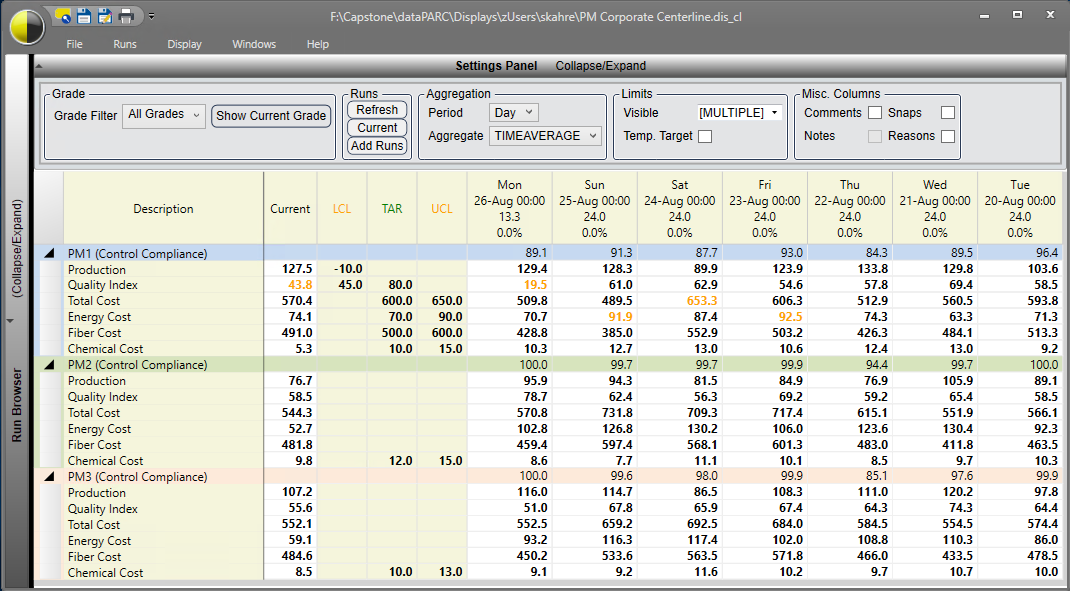
Aggregate statistics from multiple processing units or sites can be included in a single Centerline display in dataPARC. Centerline tags can be arranged into “Groups” which contain KPI tags from each site or production line. A Control Compliance calculation can be made for each group and displayed in the top row of that group’s section. This indicates the overall performance of the group during each time period or run displayed on the Centerline. The example below provides production, quality, and cost averages for each of three paper production lines. Control Compliance percentages are also included for each line.
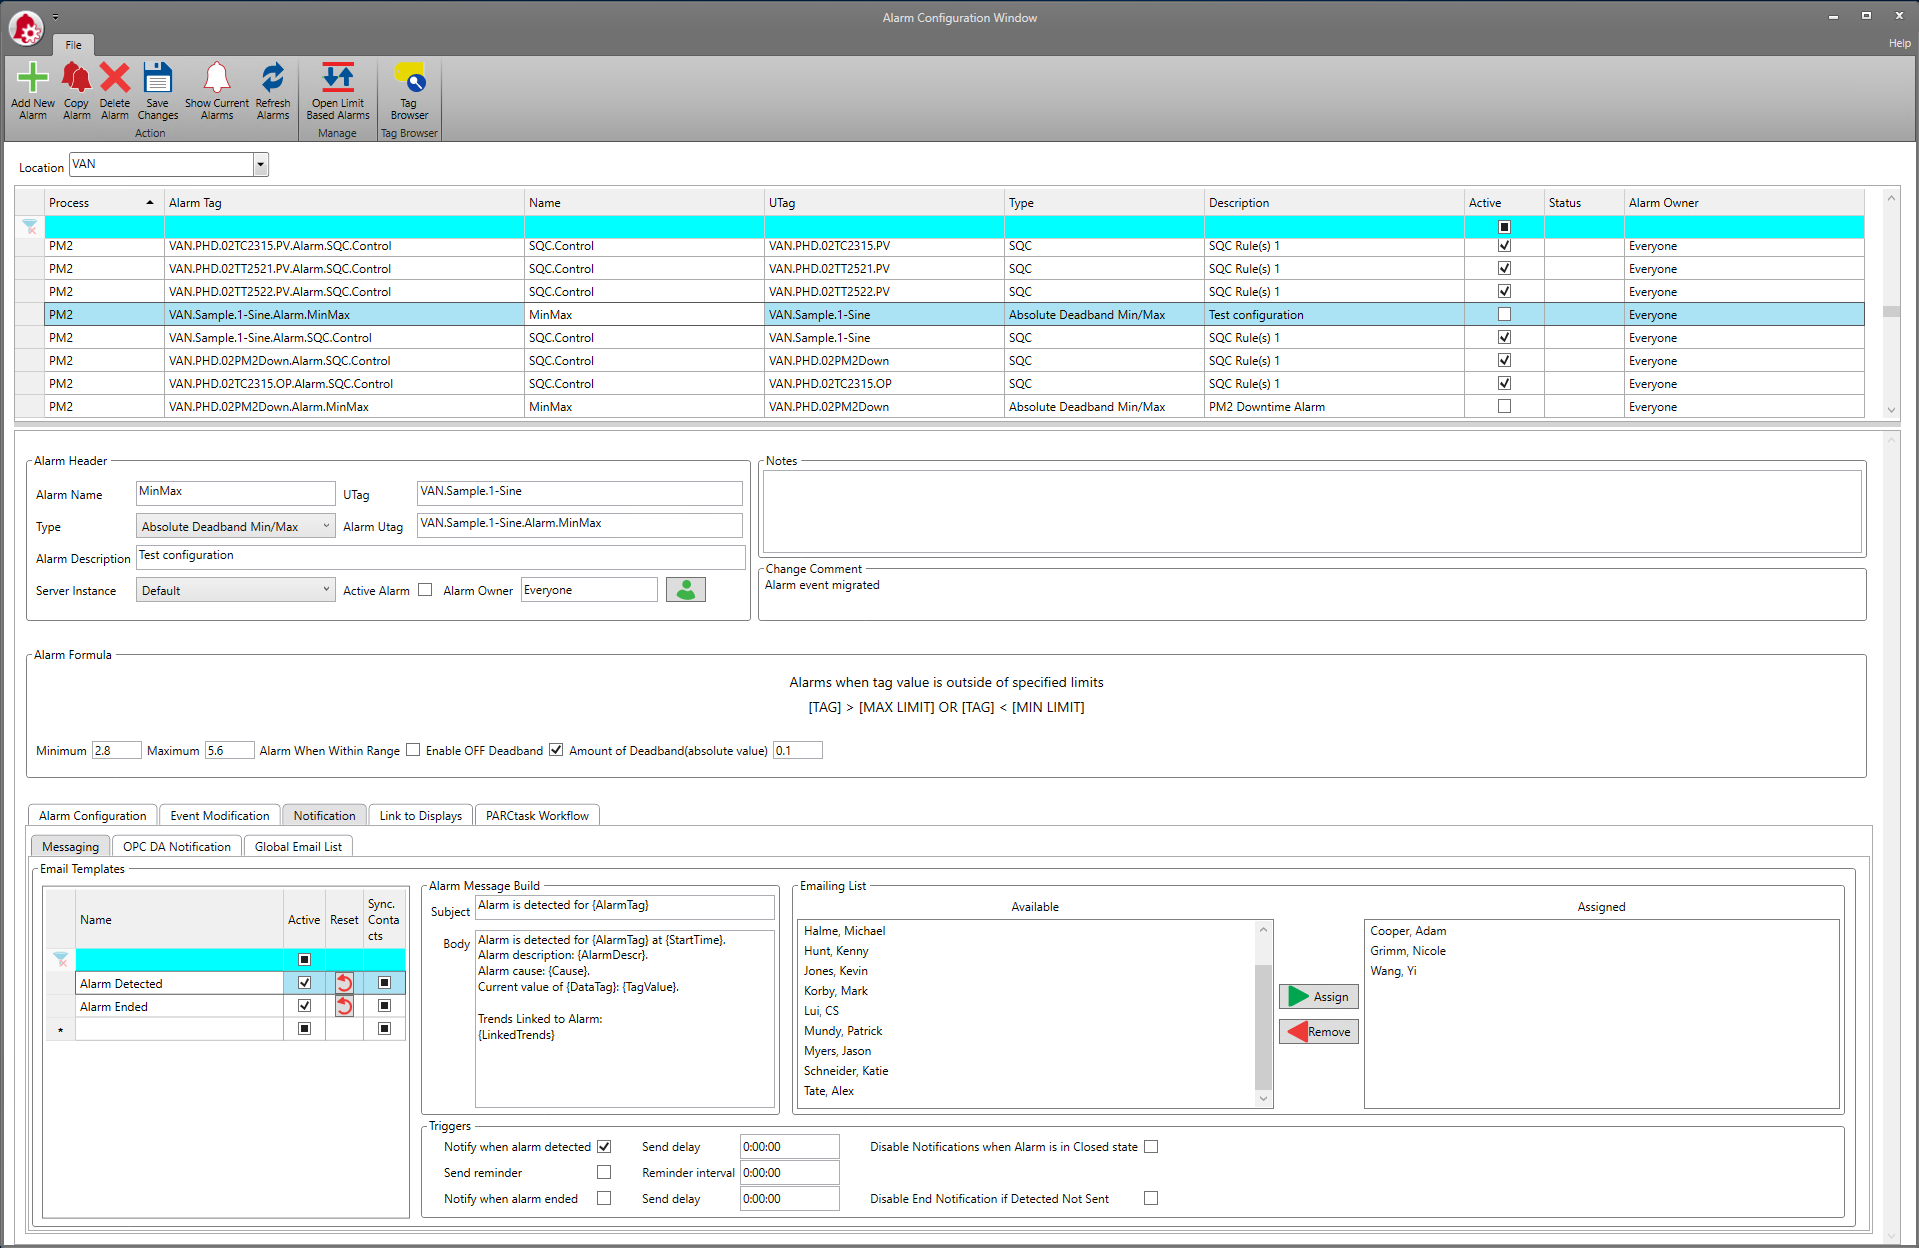
Alarm Server for Performance Notifications
dataPARC’s Alarm Server provides a highly customizable platform for triggering events and notifications based on SQC rules or various deviations from assigned targets or limits. Alarms can be configured based on any tag, including calculated KPI tags from multiple sites or production lines. The example below shows an alarm with e-mail notifications configured for both the time of detection and the end of the alarm event. The e-mail message can provide detailed information about the type of alarm, it’s time of occurrence, and even links to trends or other displays that can provide insights into the situation. At the enterprise level, these alarm notifications can alert management staff to potential process-wide deviations from normal operation.
