Create a Pareto Chart
- 06 Feb 2024
- Print
- PDF
Create a Pareto Chart
- Updated on 06 Feb 2024
- Print
- PDF
Article summary
Did you find this summary helpful?
Thank you for your feedback!
Purpose: Practice creating a Pareto chart from a Trend.
Task: Create a new Trend of a tag that has acknowledged alarm events saved against it, change the time span as needed, and then make a Pareto chart of the data.
Steps:
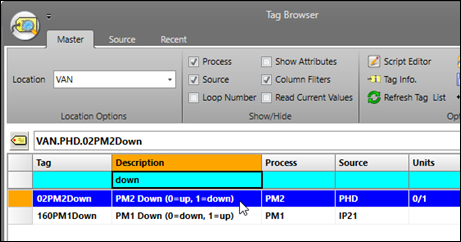
In Tag Browser, filter for a tag that has acknowledged alarm events saved against it. Double-click the tag row to launch a Trend.
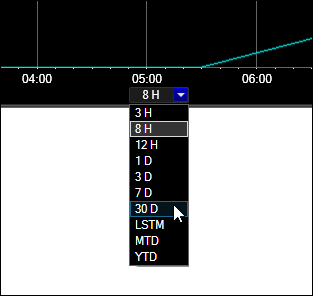
Use to time picker to change the time span of the Trend to the desired time range.
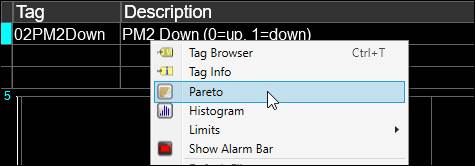
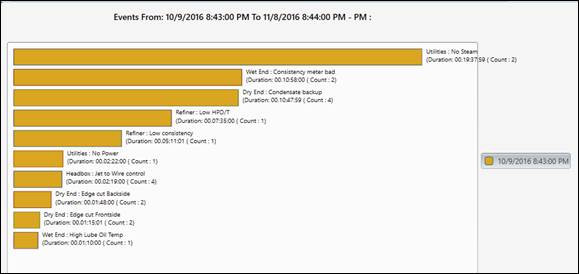
Right-click on the tag in the tag grid, then select Pareto. The resultant Pareto chart uses the source Trend’s time span.
Was this article helpful?