PARCgraphics displays combine graphical elements and live process information to give a real-time view into process operations.
A single PARCgraphics display may contain many different types of information-rich elements: dynamic objects like gauges and tanks that are “bound” to UTags so that they are animated by tag values, configurable alerts that trigger animations such as blinking effects when specified conditions are met, interactive objects like buttons and drop-down menus, and even other PARCview displays embedded directly in the graphic itself. PARCgraphics typically show current values but can also show aggregated values, such as hourly averages. The Play Back feature allows for reviewing historical data, as well.
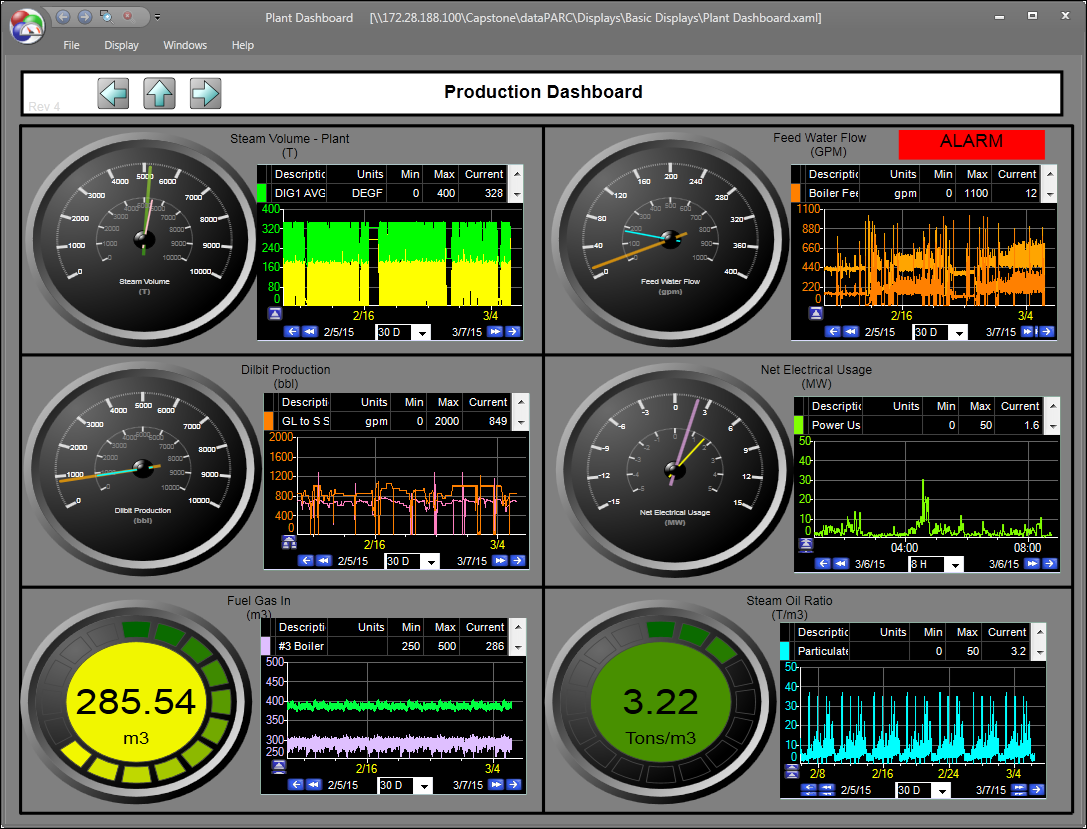
PARCgraphics are highly customizable and can be built to suit a wide variety of purposes. Most graphics displays fall into two general categories: process diagrams, which display an overview of a whole process, and “dashboards”, which give a quick view of key process metrics. For example, in a process diagram, the layout of the graphic may represent the actual positions of equipment in the field and the flow of the process, whereas a dashboard may organize information with an emphasis on effectively displaying important process variables.