The data columns show run statistics based on the centerline’s time period type and statistic/aggregate type.
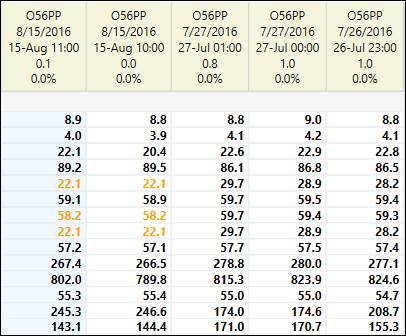
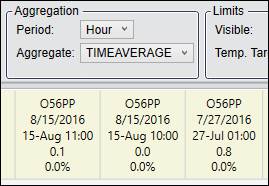
Each column represents a run or a period of time like an hour, production day, or grade run, based on the selected Period type. The selected Aggregate is calculated over the duration of each run.
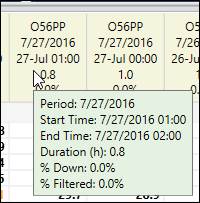
The data column headers show some of the data about the run based on what was chosen in the Run/Statistic Type menus. Hover over a data column header to see expanded information about the run.
Data Columns Header Right-Click Menu
Right-click a header in the data column section to see the right-click menu options available.
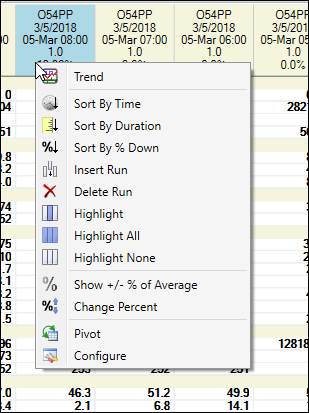
Trend: Launches a trend using the timespan of the column selected and the trend selected in the Trend Drop-Down Menu. There must be a trend set in the Settings tab of the properties menu in order for this Trend option to work.
Sort By Time/Duration/% Down: These three options will sort the columns of data by whichever variable is selected.
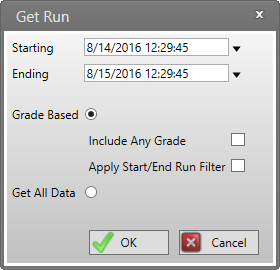
Insert Run: The Get Run window will appear when Insert Runis selected. This will allow another run to be added into the centerline for a custom period of time. A date and time range can be selected as well as whether the data will be grade-based or whether all data will be included.
Delete Run: This will delete the data column that was right-clicked.
Highlight, Highlight All, and Highlight None: Selecting these will either highlight the one column right-clicked, highlight all columns, or un-highlight all columns. Highlighting is used to either save the run(s) or to determine which runs to show in the histogram, trend compare, or trend consecutive displays.
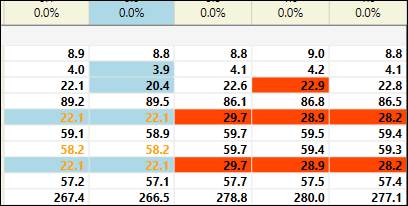
Show +/- % of Average: Once selected, all values that are either higher or lower than the specified percentage from the average of the value in the row for a tag will be highlighted. This option will stay turned on until selected again, which will turn it off.
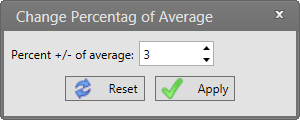
Change Percent: Selecting this option will open a window where the percentage amount from average can be changed.
Pivot: Enable pivot mode (flip rows and columns).
Configure: Opens the Properties window.
Data Columns Right-Click Menu
Right-click a tag row under any of the data columns to see the right-click menu options available.
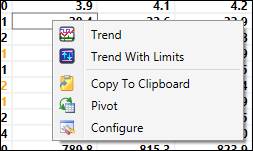
Trend: Clicking Trend will launch a trend of the tag using that column’s timespan.
Trend With Limits: Launches a trend of the tag using that column’s timespan with the limits from the centerline enabled in the trend. Only displayed when limits are enabled for that tag.
Copy To Clipboard: Copies the Centerline data to the Clipboard, from where it can be pasted into applications like Microsoft Excel.
Pivot: Enable pivot mode.
Configure: Opens the Properties window.