Purpose: Practice changing the properties of tags in a Trend display.
Task: In a Trend display, open the Properties window. On the Tag Config tab, use the various columns to make Trend-specific changes to the way tag values are plotted or shown.
Steps:
Open an existing Trend display or create a new one.
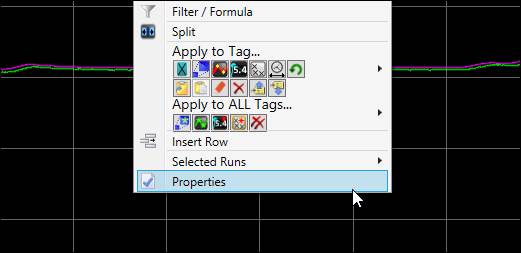
Open the Properties window. Right-click either the tag grid or the plot area and select Properties.
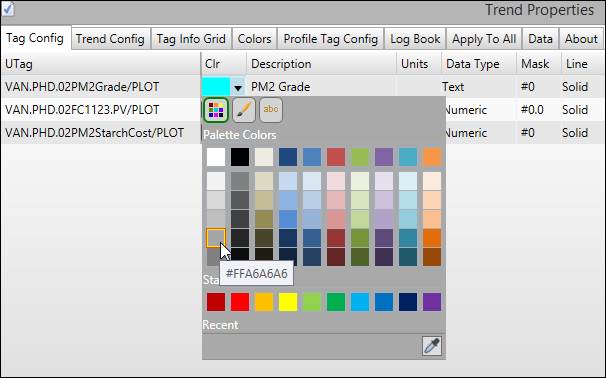
On the Tag Config tab, use the Clr column to change the color of a tag’s trend line.
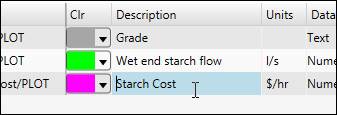
Modify the Description column to customize the tag’s description in the trend. Note: this change is local to this Trend only and will not affect other displays.
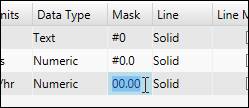
Use the Mask column to change the number of places after the decimal for tag values shown in the Trend. Enter “0” for a forced digit and “#” for an unforced digit.
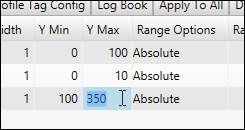
Modify the trend-specific default plot min and plot max of tags using the Y Min and Y Max columns.
Click OK in the lower-left-hand corner to apply changes.