Purpose: Create tags from an Excel sheet and Trend their data using the Tag Browser.
Task: Use the Excel source in Tag Browser to Trend data contained in an Excel sheet by configuring the mapping between Excel and PARCview.
Steps:
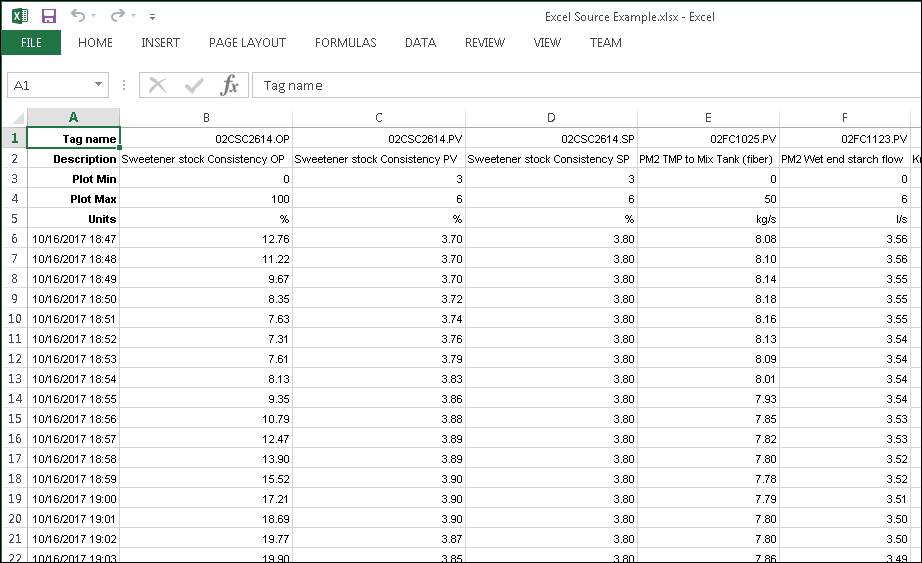
Get the tag data in Excel in the time-series format that PARCview expects. At a minimum, there must be a column for timestamps, and a row for tag names. Note that this must be a short tag name, not a full UTAG (Location.Source.Tagname). Rows for tag descriptions, plot mins, plot maxes, and units are optional. The rest of the cells contain tag data.
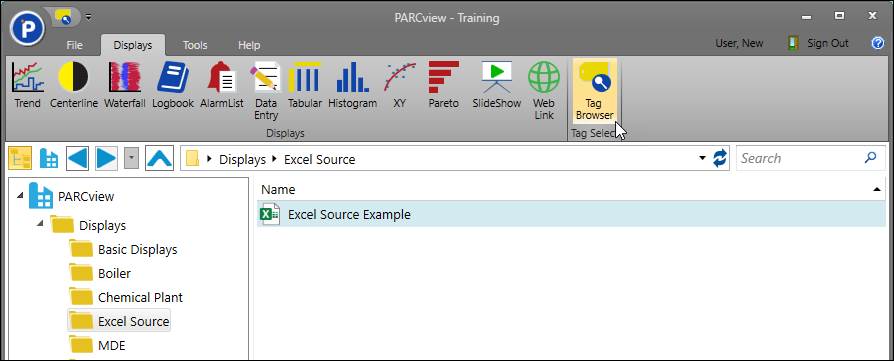
In PARCview, open the Tag Browser.
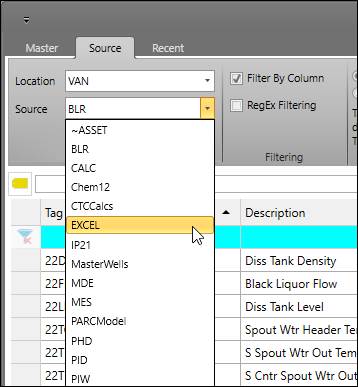
On the Source tab, select the EXCEL source.
The Tag Browser interface will change to the form used to configure the mapping between Excel and PARCview.
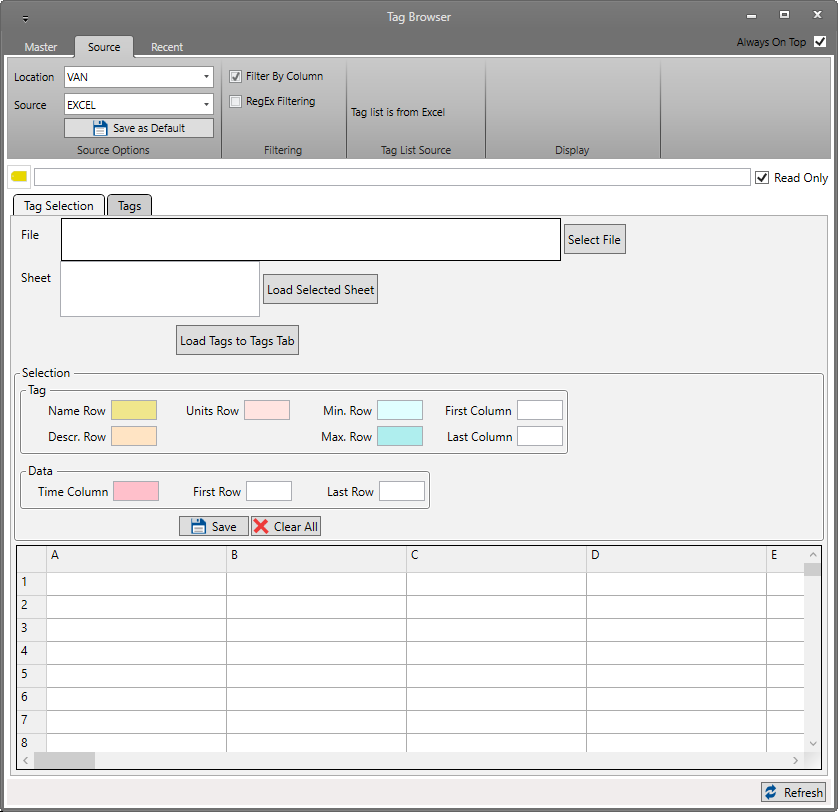
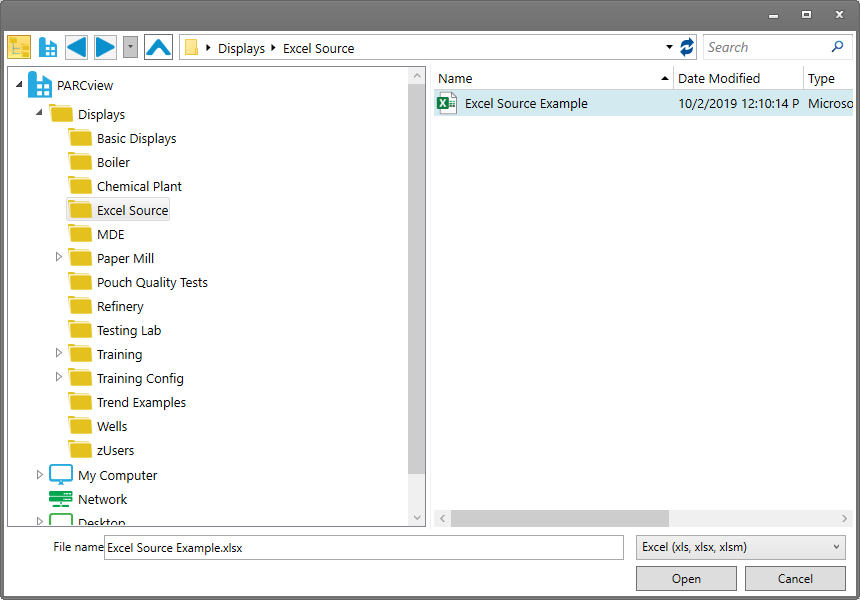
Click Select File to launch a file browser.

Open the Excel file.
The sheets within the workbook will load. Make sure the correct sheet is selected if there are multiple sheets in the workbook, then click Load Selected Sheet.

The data grid below will populate with the Excel data. It helps to resize Tag Browser to get a better view of the populated data grid.
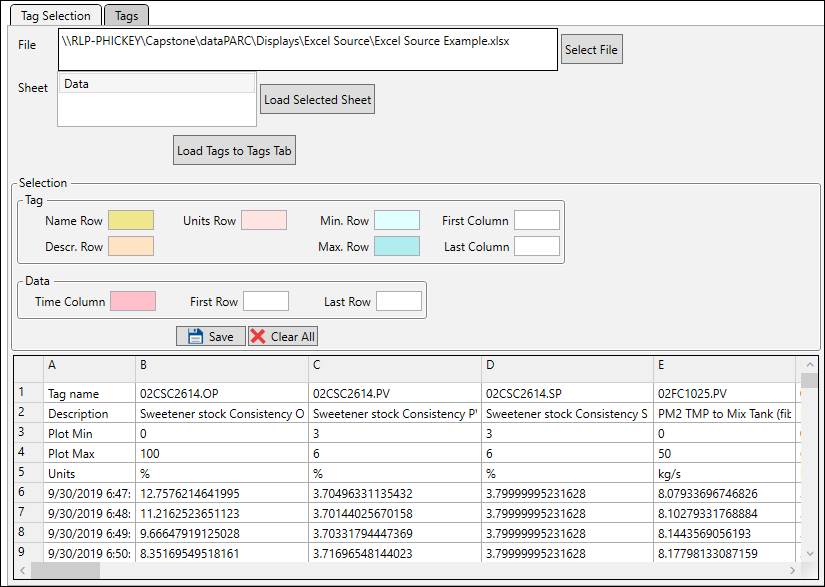
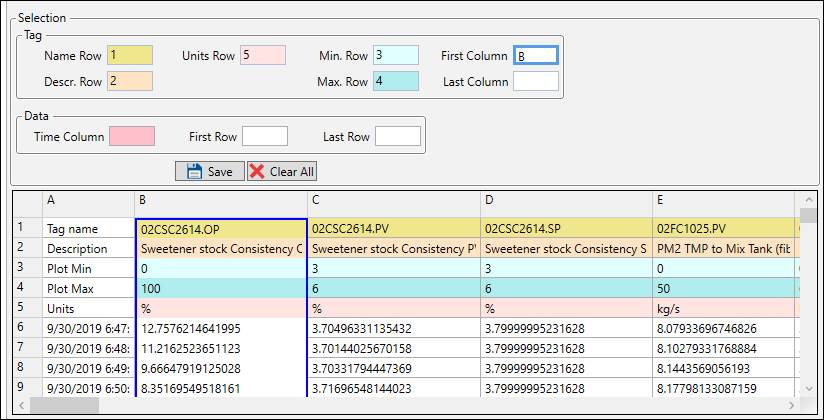
In the Tag section, enter the appropriate row numbers for the rows that define the tag attributes and the column letter of the first data column. The last column is optional unless there are non-data in the sheet that need to be ignored. Based on the entered values, ranges of cells in the data grid will highlight with the corresponding color.
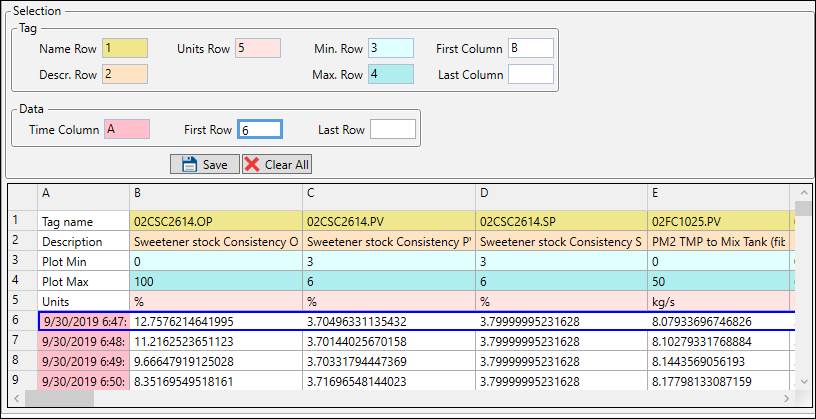
Next, configure the mapping for the Data section. Enter the column letter of the column that contains timestamps, then enter the row number of the first row that contains data. The last row is optional unless there are non-data in the sheet that need to be ignored.
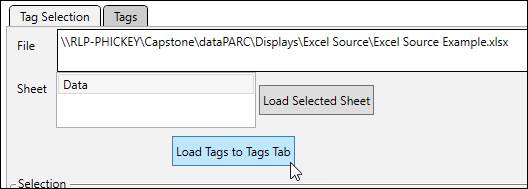
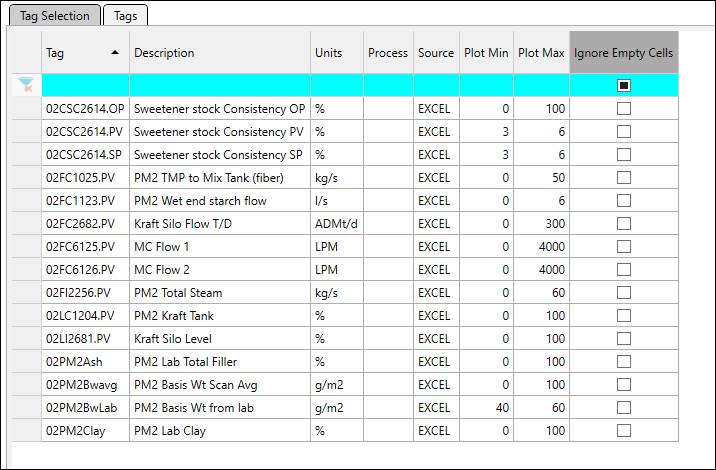
Click the Load Tags to Tags Tab button to create the Excel tags and switch to the Tags tab. Double-click a tag to launch a Trend, or drag and drop the tags into PARCview displays.
