The Colors tab of Trend Properties contains options for configuring the colors of the trend display into a custom theme or selecting preconfigured themes. The trend line, grid line, Tag Info Grid, Plot Area, and Time Bar colors can all be customized.
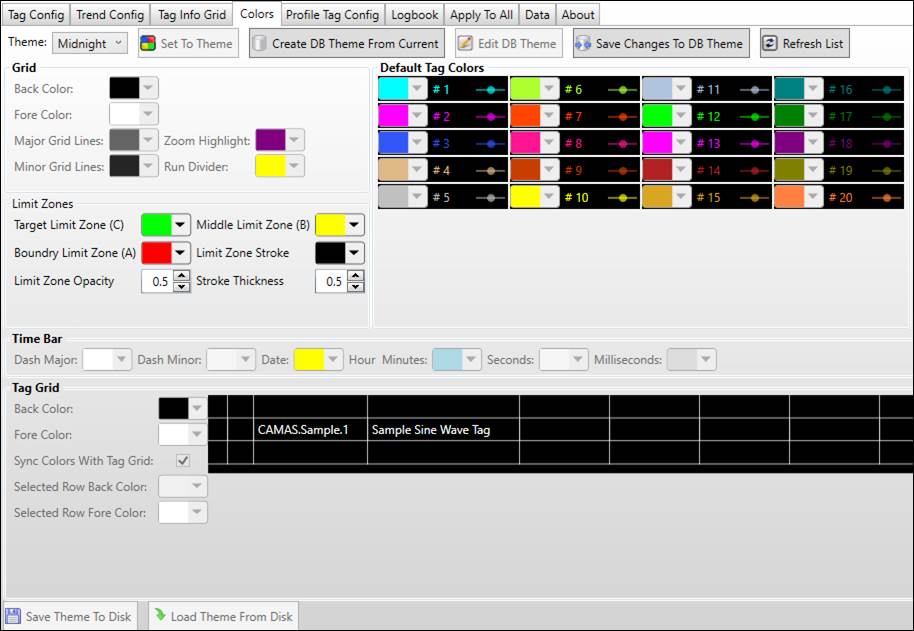
Theme: Choose from a list of pre-configured themes to affect the overall color scheme of trend. Choose the Custom theme to edit the colors individually.
Set to Theme: Overwrite default or DB theme with custom theme.
Create DB Theme From Current: Save current settings to database as a theme.
Edit DB Theme: When a DB theme is selected, enable editing.
Save Changes To DB Theme: Saves changes to the custom DB theme.
Refresh List: Reload items in Theme drop-down menu.
Grid: These options control the colors on the plot area. Click the colored boxes to open the color editor.
Back Color: Background color of the plot area.
Fore Color: Color of X- and Y-axes, X-axis labels, SmartMouse and Quick Statistics font.
Major Grid Lines: Color of major grid lines.
Minor Grid Lines: Color of minor grid lines.
Zoom Highlight: Color of region selected by clicking and dragging.
Run Divider: When in run mode, color of run dividers.
Limit Zones: These options control defaults for the limit zone settings on the Trend Config Tab. Can be overridden by individual trends.
Target Limit Zone (C): Use color picker to set color of zone C.
Middle Limit Zone (B): Use color picker to set color of zone B.
Boundary Limit Zone (A): Use color picker to set color of zone A.
Limit Zone Stroke: Color of line between limit boundaries.
Limit Zone Opacity: Opacity of limit zone coloring.
Stroke Thickness: Thickness of line between limit boundaries.
Time Bar: Changes the Dash Major, Dash Minor, and Date colors of the Time Bar. The time setting colors are used to differentiate the units on the x-axis labels.
Date: The color of dates on the time bar in the M/D format.
Hour Minutes: The color of times in the HH:MM format.
Seconds: The color of time labels that are in increments of seconds.
Milliseconds: The color of time labels that are in increments of milliseconds.
Tag Grid: Changes the Back Color and Fore Color of the plot. The Sync Colors with Tag Grid option copies the Back Color and Fore Color from the Grid colors.
Default Tag Colors: These fields control the default color tags’ trend lines based on the order in which they are added to the Trend. Clicking a field opens the color selection window.
Save to Disk: Save a custom theme as a file.
Load Theme from Disk: Load a custom theme from a file.