The chart properties only appear if the control is a chart.
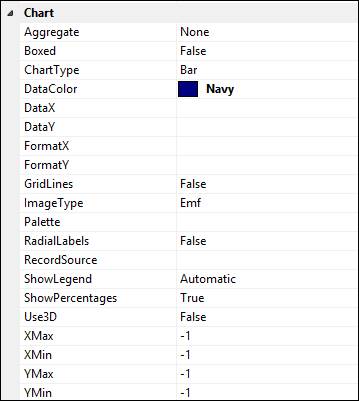
Aggregate: How values should be aggregated on the chart.
Boxed: Draws a box around the plot area.
ChartType: The chart type. Available types are Area, Bar, Pie, Scatter, Line, and Column.
DataColor: The color for the chart bars, lines, symbols, or pie slices.
DataX: A string containing one field with the chart labels.
DataY: A string containing one or more fields with the data to plot on the chart. Fields are separated by a semi-colon.
FormatX: The annotation format for the X -axis.
FormatY: The annotation format for the Y-axis.
GridLines: Adds gridlines to charts. The property does not apply to Pie charts.
ImageType: The type of image generated by the chart.
Palette: A collection of colors to be used for each series (or pie slices).
RadialLabels: This property only applies to Pie charts. It causes the field to add radial labels attached to the pie slices instead of a legend.
RecordSource: A SQL statement to use and retrieve data for the chart.
ShowLegend: Indicates whether the chart should include a legend.
ShowPercentages: This property only applies to Pie charts. It causes the field to add percentage labels to the pie slices.
Use3D: Applies 3D effects to the charts.
XMax: The maximum value for the X-axis.
XMin: The minimum value for the X-axis.
YMax: The maximum value for the Y-axis.
YMin: The minimum value for the Y-axis.