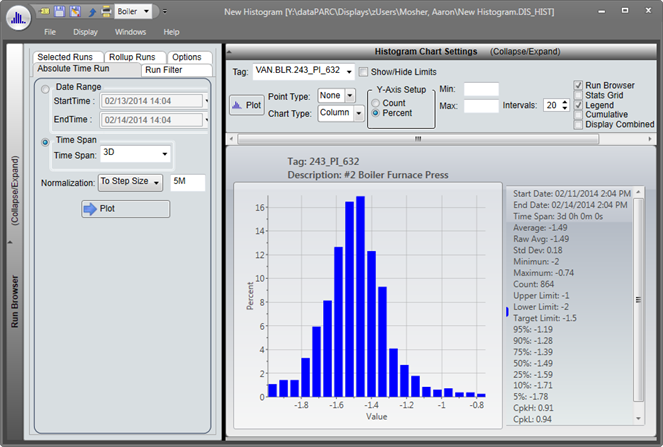
Purpose: Learn how to create a Histogram chart from scratch that will auto-load a timespan on open.
Task: Browse to your user folder and then create a new Histogram display. Open it, add a tag to the chart, and view the data for various timespans. Then on the Display tab check AutoLoad and save the display. Close and reopen to see the data autoload.
Steps:
Go to your specific user folder under.
Right-click in file list area and choose Add Display -> Histogram.
Rename the Histogram, then open it.
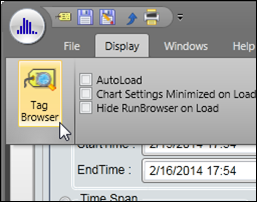
In the Histogram, open the Tag Browser from the Display tab.
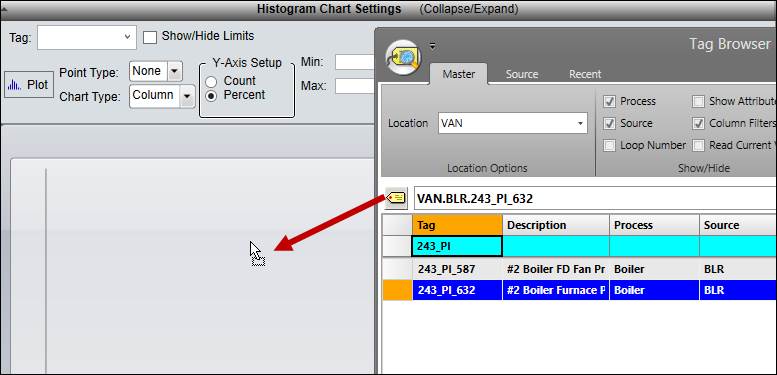
Select a tag and then drag it onto the Histogram.
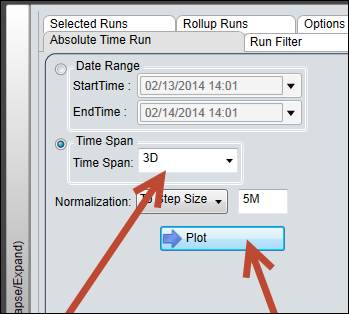
Change the timespan to the last three days. Make sure that a Time Span of 3D is selected.
Click the Plot button.
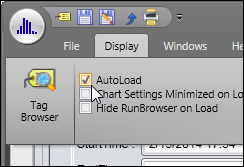
On the Display tab check AutoLoad
Select Save As from the File tab and save the Histogram as “Autoload” in your user folder.
Close and reopen the Histogram to see it autoload the timespan and data.
