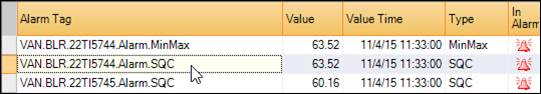
Double click an alarm tag row in the PARCalarm Server console to open the Alarm Information display.
This display shows the Alarm Tag that was selected and has 4 tabs. The Alarm Processing Info tab is selected by default.
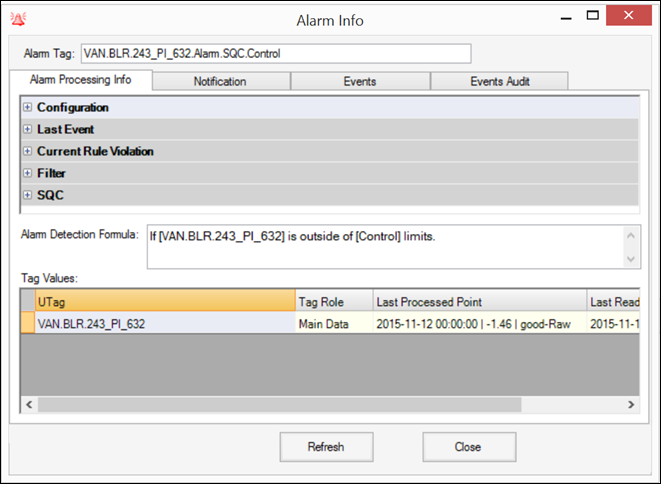
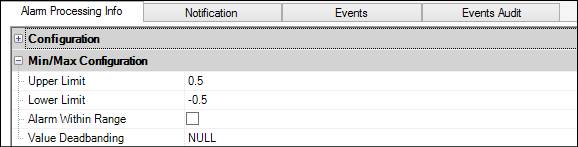
Alarm Processing Info
Five groups of information are provided: Configuration, Last Event, Current Rule Violation, Filter and SQC. Click the “+” to the left of the group name to expand it.
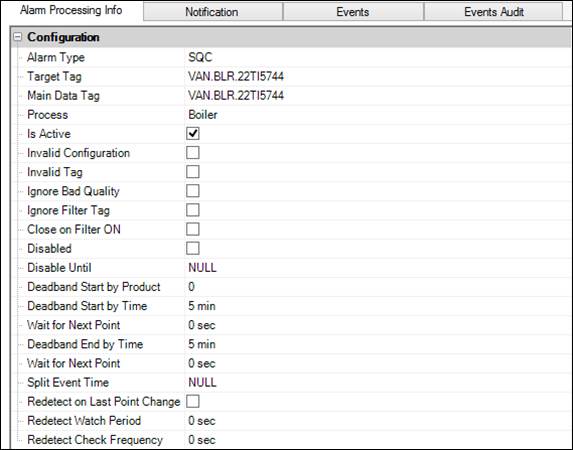
Configuration: Alarm configuration settings that are set in Alarm Configuration.
Min/Max Configuration (only MinMax alarms): The MinMax limits and the value deadband for the alarm.
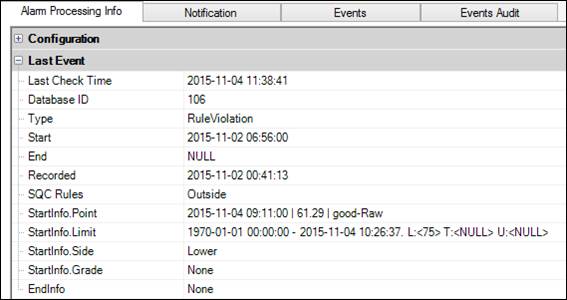
Last Event: Detailed information about the most recent event for this alarm.
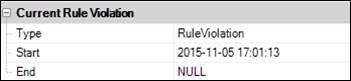
Current Rule Violation: Displays the type and timing of the most recent violation. If the alarm is still in effect, End will be “NULL”.
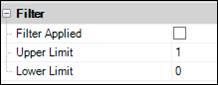
Filter: Displays the process filter in effect for this alarm, if any, and whether it is applied to this tag (checkbox).
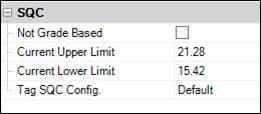
SQC (only SQC alarms): The configured SQC limits for the tag and corresponding alarm settings. If the tag is grade based, it will show the limits for the current grade that is running.
Alarm Detection Formula: The alarm logic in words.

Tag Values: The current tags involved with the alarm, including the main data, filters, and alarm limits. The Tag Role and most recent processed and read times are displayed.

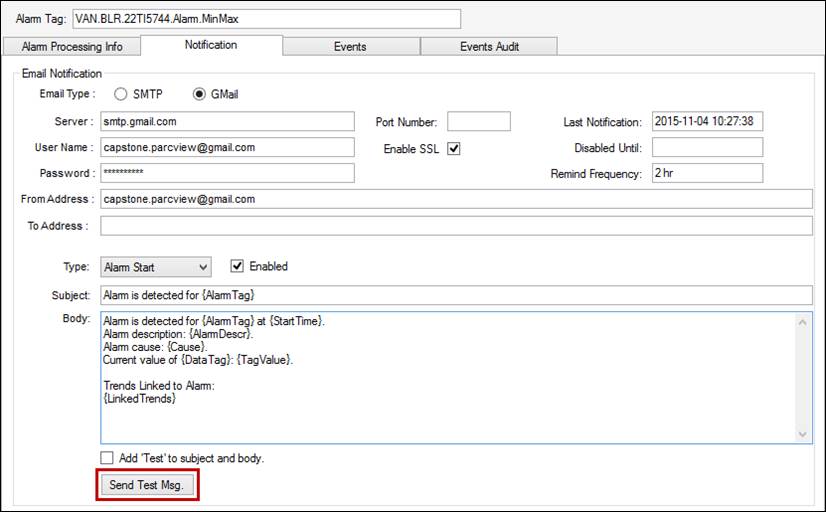
Notification
This tab contains the email settings from System Configuration as well as options for logging alarm processing details in the Alarm Server log file.
The Email Notification group box contains the email settings established in System Configuration as well as the specific email settings for the alarm from Alarm Configuration. Click Send Test Msg to send an alarm message and verify that the email connection is set up properly. If necessary, enter an email address in the To Address field. This will only be used for the test and will not change the base configuration for the alarm tag.
The Logging group box contains options for alarm processing information to be displayed in the Alarm Server log file. For troubleshooting, checking all boxes is recommended to display all of the available information about the alarm.

Violation Start/End: Displays the start and end time of when the tag was in the alarm state.
Event Recording: Displays additional information relative to the event beyond start and end time.
Point Processing: Displays the values of all relevant tags that are processed for the alarm.
Detection Details: Displays all details of the alarm event. This option is verbose and will generate a significant amount of information to the log file for each event.
After closing the Alarm Info display, the logging preferences will automatically apply during the next cycle. If the Alarm Server is restarted the selections will be lost. Click Save Logging Config in the Alarm Server Ribbon Bar to apply the changes to all future cycles, even after a restart.
The default storage location for the event log is AlarmServer.log in C:\Program Files (x86)\Capstone\PARCAlarmServer\LogFiles.
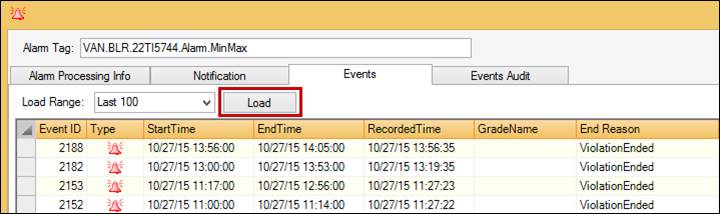
Events
Select a range of events in the Load Range drop-down menu. The default is the last 100 events.
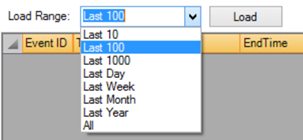
Click Load to load the events. Only basic event information is provided in this tab.
Events Audit
Select a range of event audits in the Load Range drop-down menu. The default is the last 100.
Click Load to load the event audits.
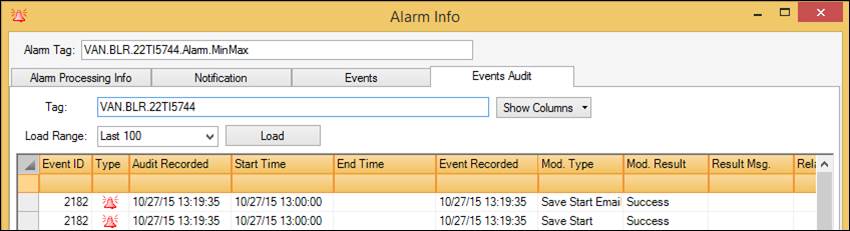
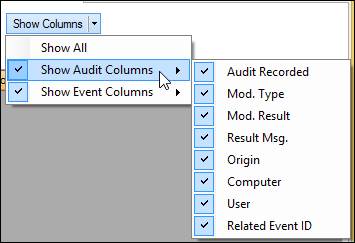
Much more detail is displayed than in the Events tab, including modifications to events. To change which columns are visible, click the Show Columns drop-down menu and check or uncheck specific columns.