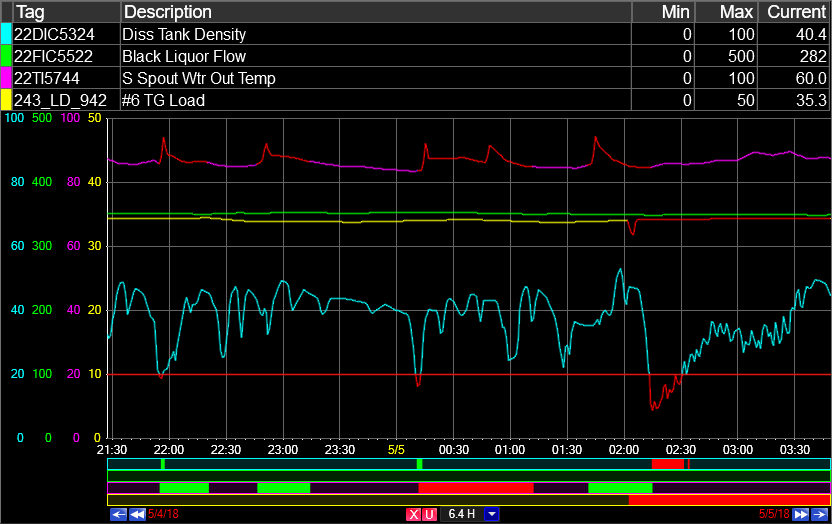
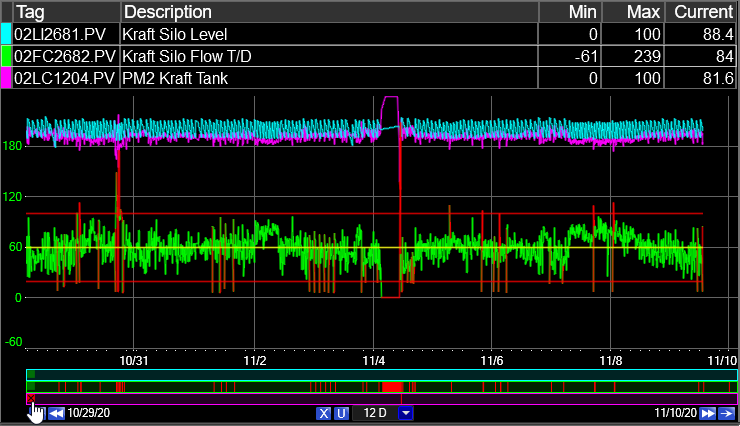
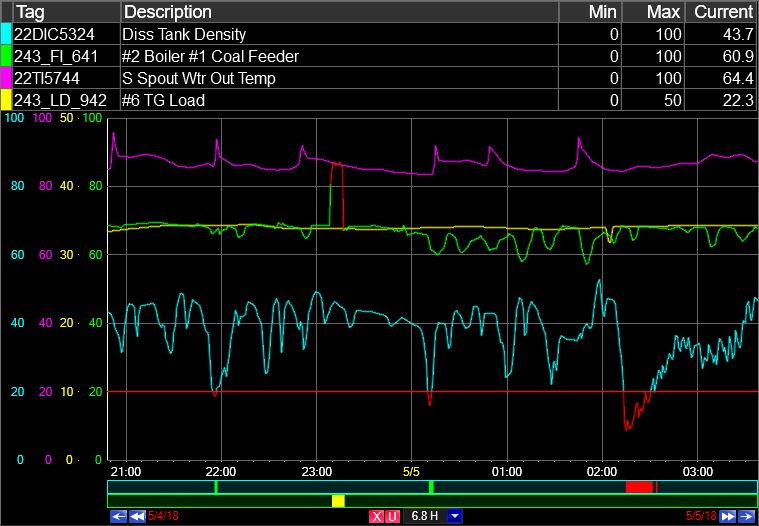
When enabled through the tag info grid right-click menu, a tag-specific alarm bar will appear along the time axis, between the time labels and the time navigation buttons. The border color of the bar matches the color of the corresponding trend line. When multiple alarm bars are enabled, their top-to-bottom order corresponds to the order of the tags in the tag info grid.
The alarm bar shows alarm events associated with a tag. Users can acknowledge alarm events by assigning reasons, comments, equipment, or evidence.
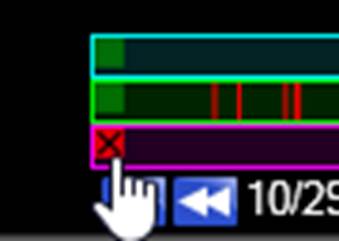
Limit Toggle
When limits and the alarm bar are both enabled for a tag, a box on the upper left of the alarm bar toggles limit visibility. This is especially useful when limits and the alarm bar are enabled for multiple tags.
Trend Alarm Events
In general, an alarm event is a single instance of an alarm rule violation, and the duration of the event is the amount of time the rule was in violation. Examples of alarms include simple Min/Max rules and alarms based on SQC rules. PARCalarm Server alarms are defined in Alarm Configuration. Alarm events can also be created manually or calculated by a trend based on tag limits. See Alarm Event Types for more information.
In a Trend, alarm events appear as a colored section of the alarm bar that is aligned with the time of the event. The length of the colored section corresponds to the duration of the event.
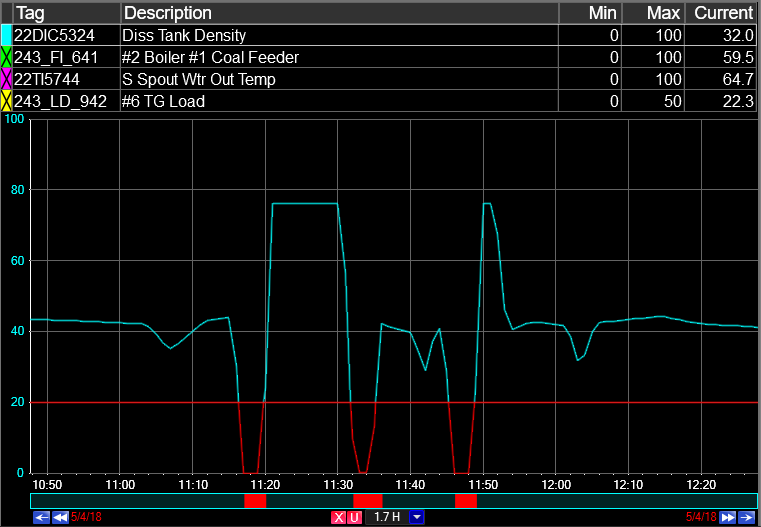
The color of the section corresponds the acknowledgment state of the event. These are the default values:
Red = Unacknowledged
Yellow = Acknowledged
Green = Cleared
These colors can be changed system wide in System Defaults or in a specific display in Trend Configuration.
For more on acknowledging alarm events, see Alarm Event Acknowledgment.
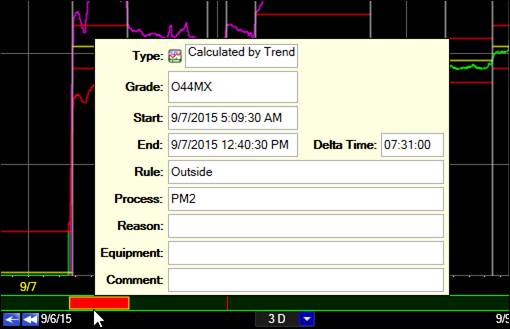
Hovering the mouse over an event on the bar shows information about the alarm event. Clicking on the alarm event opens the Edit Alarm window.
Alarm Event Types
Alarm Event Types can be broken down into three categories, based on the source of the event:
Alarm Server: Generated by PARCalarm Server based on the alarm definition in Alarm Configuration.
Manual: Generated by user, either by creating a new event or by saving a calculated event. Note: the Trend will make a distinction between ad-hoc events and events created from a calculated event, but Pareto will treat both types as manual events.
Calculated: Generated by a Trend based on Tag Limits. These events do not exist in the database until they are saved or acknowledged by users, at which point they become “manually created” events. Note: Trends calculate events using the data known to the trend. As a result, at larger timespans plot reduction may affect the duration of the calculated events. Also, the trend will start and end events where the trend line intersects the limit line, so event times and durations may not match those that would be created by Alarm Server.
This table lists the alarm event types:
Category | Type | Description |
Alarm Server | Alarm Server | Generated by PARCalarm Server |
Alarm Server | Alarm Server – Bad Quality | Generated by PARCalarm Server from bad quality data |
Manual | Created by User | Created by User with the Save Event option in the Plot Area right-click menu or by adding an event from Assign Cause. |
Manual | Created by User from Calculated | Created by User by saving a calculated event. Splitting or merging calculated events will also create manual events. |
Calculated | Calculated by Trend | Generated by a Trend based on Tag Limits. |
The visibility of alarm event types in the alarm bar can be configured in the Alarm Bar right-click menu.
Alarm Event Acknowledgment
Users can respond to, or acknowledge, alarm events from a Trend by entering information associated with the event, such as a reason code, a piece of equipment, or a text comment. Alarm events are acknowledged in the Edit Alarm window or in Assign Cause.
Alarm events have three stages of acknowledgment:
Unacknowledged: The event has not been responded to by the user.
Acknowledged: The alarm’s acknowledgment criteria have been met.
Cleared: The alarm’s clearing criteria have been met.
Acknowledgment and closing criteria can include whether or not a reason, a comment, equipment, or evidence has been assigned, as well as whether the event has ended or been saved. See Alarm Acknowledgement Logic for more information.
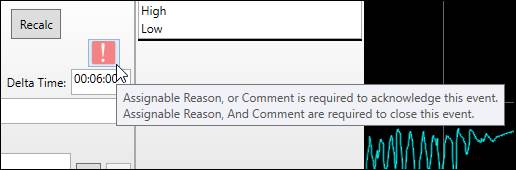
Acknowledgment Warning
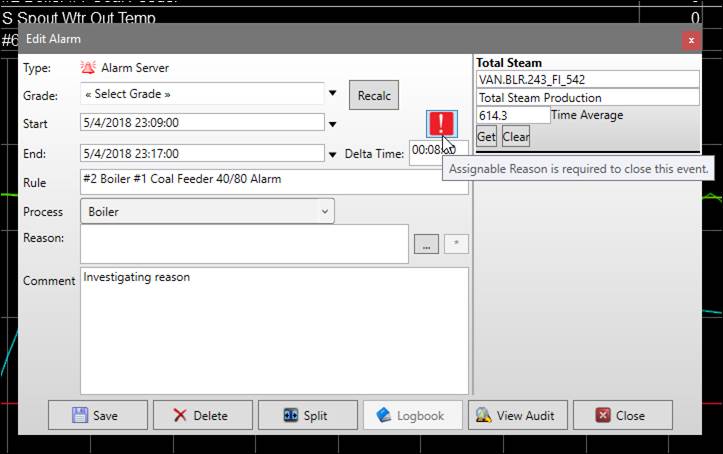
In both Edit Alarm and Assign Cause, if the event is in the open or acknowledged state, a red exclamation point warning icon will alert users that acknowledgment (or further acknowledgment) is required. Hover over the icon to see a message that describes the outstanding acknowledgment items.
Edit Alarm
To open the Edit Alarm window, click on an event in the Alarm Bar.
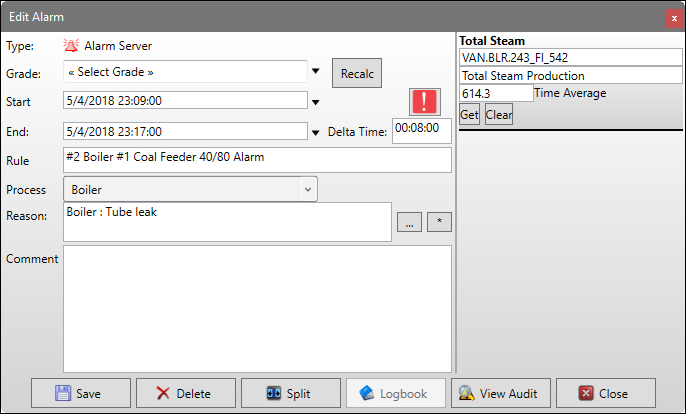
Type: The alarm event type.
Grade: In the drop-down menu, the grade assigned to the alarm event can be modified. This value is automatically populated with the value from the grade tag of the base tag’s process area at the start of the alarm event.
Recalc: Recalculates the grade value and assigns the active grade from the time of the event.
Start Time: The start time of the alarm event. Open the drop-down to use the date-time picker to modify the time.
End Time: The end time of the alarm event. Open the drop-down to use the date-time picker to modify the time.
Delta Time: The duration of the alarm event.
Rule: The SQC rule or description of Alarm that was violated to create the event. The rule cannot be edited. Most tag limits only use the “outside” rule, but additional SQC rules can be configured in Tag Limits.
Process: By default the Tag’s process area will be displayed in this field. Changing this field will affect the alarm’s process area for reporting purposes. For example, events may be categorized by sub-process areas.
Reason: Picking a reason from the pre-defined reason tree assigns a cause to the event.
Ellipsis Button: Opens the Reason Selector.
Asterisk Button (*) / Repeat: Applies the last chosen reason to the alarm event. If a comment or evidence were entered, those are copied, too.
Comment: Typing a comment into the text box allows the user to add more information about the event.
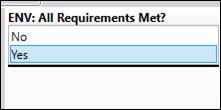
Evidence Panel: If evidence has been configured either for the selected reason or for the alarm definition, the evidence panel will appear. For tag-based evidence, the configured aggregate will be calculated automatically, though it can be recalculated if the event duration changes. For pick list-based evidence, click on the evidence values to apply.
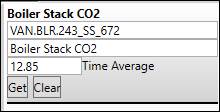
Get: Recalculate aggregate.
Clear: Clear evidence value.
Split: Opens the Event Split Time window, where alarm events can be split into two consecutive events with different cause assignments.
Save: Save all changes to the database. If editing a calculated alarm event, this will save the event to the database as a manually created event.
Logbook: If the process area of the tag in alarm has been configured to create Logbook entries when alarm events are acknowledged, click this button to preview, modify, or save the Logbook entry. This button is disabled if the auto-propagation is not configured or if a reason or comment has not been entered. If the process area’s Logbook Entry Mode is set to Manual, the user must save the entry separately, whereas if the Entry Mode is set to Auto, the entry will be created when the alarm event is saved with a reason and/or comment.
View Audit: Opens a window showing a history of changes made to the alarm event.
Acknowledgment Warning: If the event is in the open or acknowledged state, a red exclamation point warning icon will alert users that acknowledgment (or further acknowledgment) is required. Hover over the icon to see a message that describes the outstanding acknowledgment items.
Reason Selector
Use the Reason Selector to assign a cause to an alarm event from the reason tree. Click the arrow icons to collapse and expand branches of the reason tree. Reasons with red flag icons next to their names are assignable reasons, while reasons with no icon cannot be selected.
The reasons can be filtered by category. The Reason Selector may only show a specific branch of the reason tree based on the process area settings of the tag in alarm.
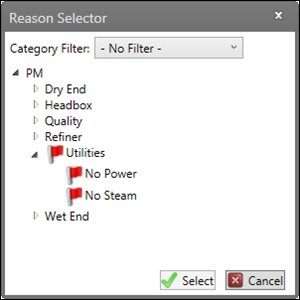
Category Filter: Open the drop-down menu to filter the reason tree by a category. Reasons are assigned to categories in System Configuration.
Select: Apply the selected reason to the alarm event.
Cancel: Close window without applying reason.
Event Split Time
Alarm events can be manually split into two consecutive events with different cause assignments. If the original event had a reason and/or comment assigned, both events will inherit the assignment, but the reason and comment can be manually changed.
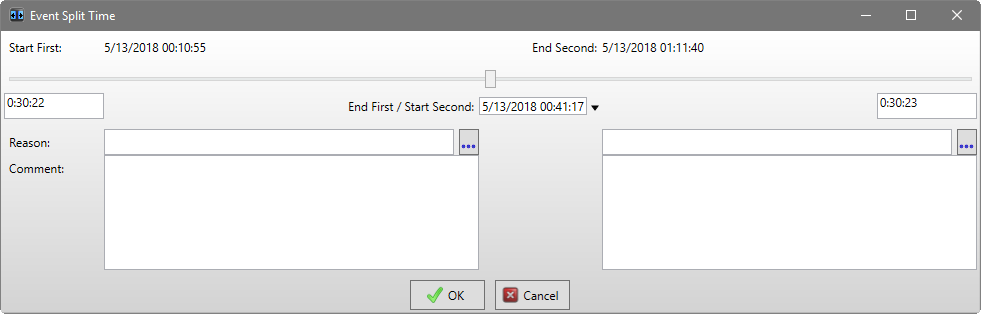
Start First: The start time of the first event.
End Second: The end time of the second event.
Slider: Drag the slider to manually adjust the split time between the two events.
First Duration: The duration of the first event.
End First / Start Second: The split time. Open the time picker or type in the field to manually set the split time.
Second Duration: The duration of the second event.
First Reason: The reason assigned to the first event.
Ellipsis Button: Opens the Reason Selector.
First Comment: The comment assigned to the first event.
Second Reason: The reason assigned to the second event.
Ellipsis Button: Opens the Reason Selector.
Second Comment: The comment assigned to the second event.
OK: Apply changes.
Cancel: Close window without applying changes.
Edit Alarm Right-Click Menu
Right-click anywhere on the body of the Edit Alarm window to open the context menu, used for locking and unlocking events.
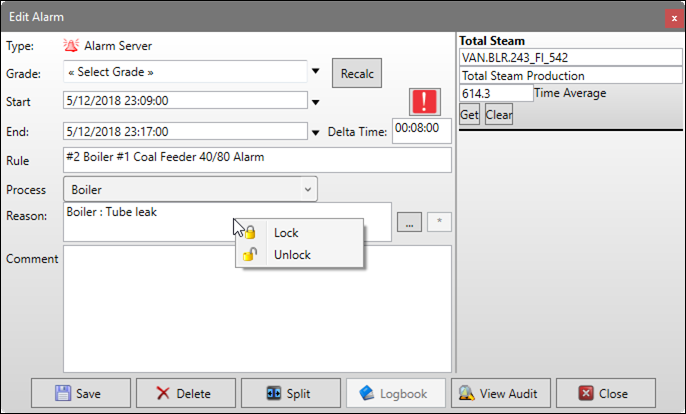
Lock: To prevent an alarm event from being edited. Right-click in the window and click Lock. If an event is locked, the window will be grayed out.
Unlock: To allow editing to a locked event, right-click and select Unlock. Requires an admin password or, if PARCsecurity is enabled, sufficient PARCsecurity permissions.
Alarm Bar Right-Click Menu
Right-click the alarm bar to open the context menu. These options control which types of events to show in the alarm bar and how to color trend lines when limit violations and alarms occur.
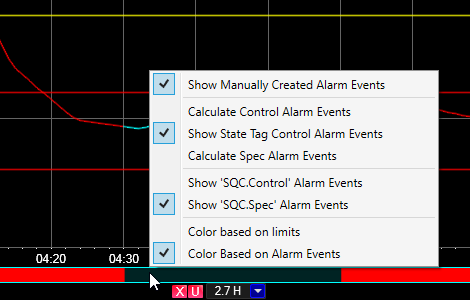
The options in this menu change based on whether limits are enabled for the tag and whether the tag has any alarms defined against it. The menu is broken into four possible sections:
Manual Events
Limit-Based Events
Alarm Server Events
Trend Line Coloring
Manual Events
Show Manually Created Alarm Events: Whether or not to show manually created alarm events, including those created by users or saved from calculated events.
Limit-Based Events
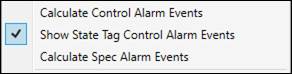
Calculate {Limit Type} Alarm Events: Whether to calculate for events for the selected limit type.
Show State Tag {Limit Type} Alarm Events: Whether to show events from a State Tag, if configured for the selected limit type.
Alarm Server Events
Show {‘Alarm Name’} Alarm Events: Whether to show events from the selected alarm.
Trend Line Coloring
These options control whether to change the trend line color when limit violations or alarms occur. The color of the trend line is configured in Tag Limits.
Color Based on Limits: Change trend line color when it crosses a limit line.
Color Based on Alarm Events: Change trend line color over the duration of an alarm event.